Скачать
Cooling Curve of Naphthalene
Автор: Michael Patenaude
Загружено: 2020-09-29
Просмотров: 11416
Описание:
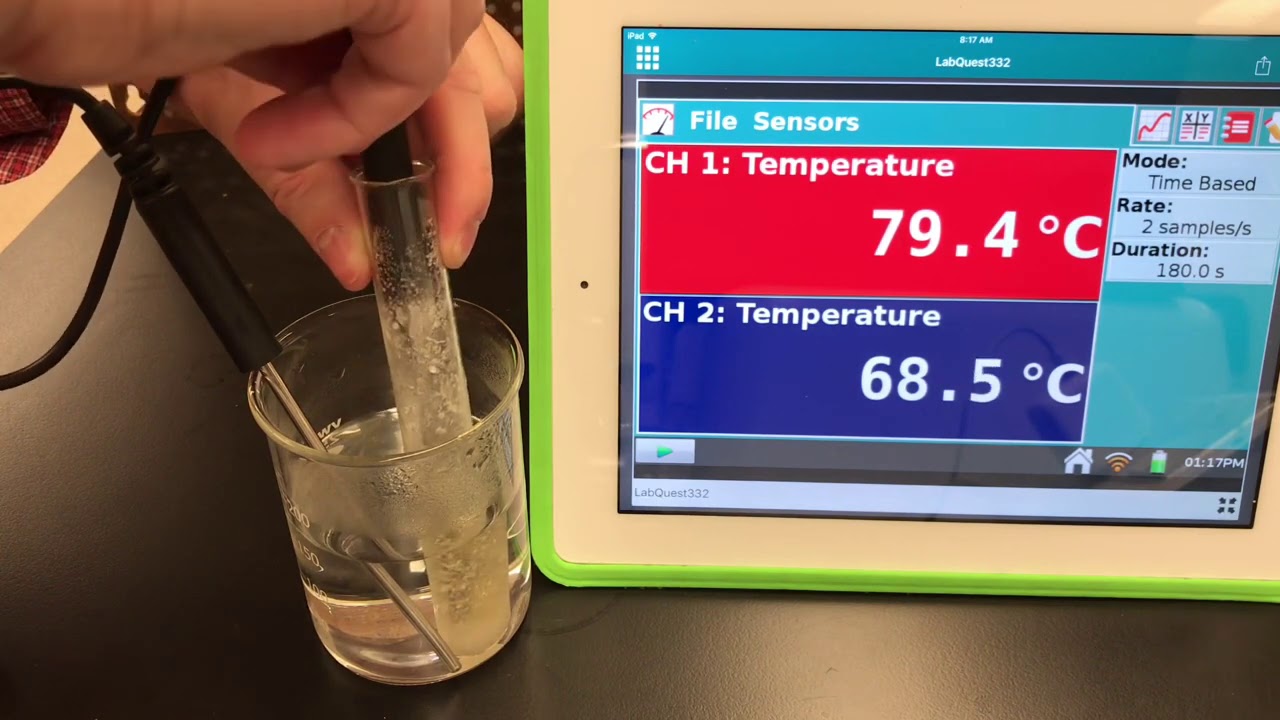
Grade 9 Advanced Science or an introductory chemistry class ... you’ll see the setup for a cooling curve experiment. Hot melted (liquid) naphthalene is put into a hot water bath and both are allowed to slowly cool down. You should record temperatures every 20 or 30 s and record the time and temperature data in a table. I would record both the naphthalene and the water temperature ... but you could just record the naphthalene temperatures if you like. When you have enough data, create a cooling curve graph ... a scatter plot with temperature on the y-axis and time on the x-axis. Use this graph to determine the freezing point of the naphthalene.
Доступные форматы для скачивания:
Скачать видео mp4
-
Информация по загрузке: