A02 - Datadog APM Explained: Traces, Spans, and Metrics
Автор: Digitam (ex-Dataiker)
Загружено: 2025-07-15
Просмотров: 5047
Struggling to understand where your app is getting stuck in production? 🤯 In this video, we demystify Application Performance Monitoring (APM) in Datadog — starting with the core building blocks: traces, spans, and the metrics that help you debug and optimize services in real-time.
You’ll learn:
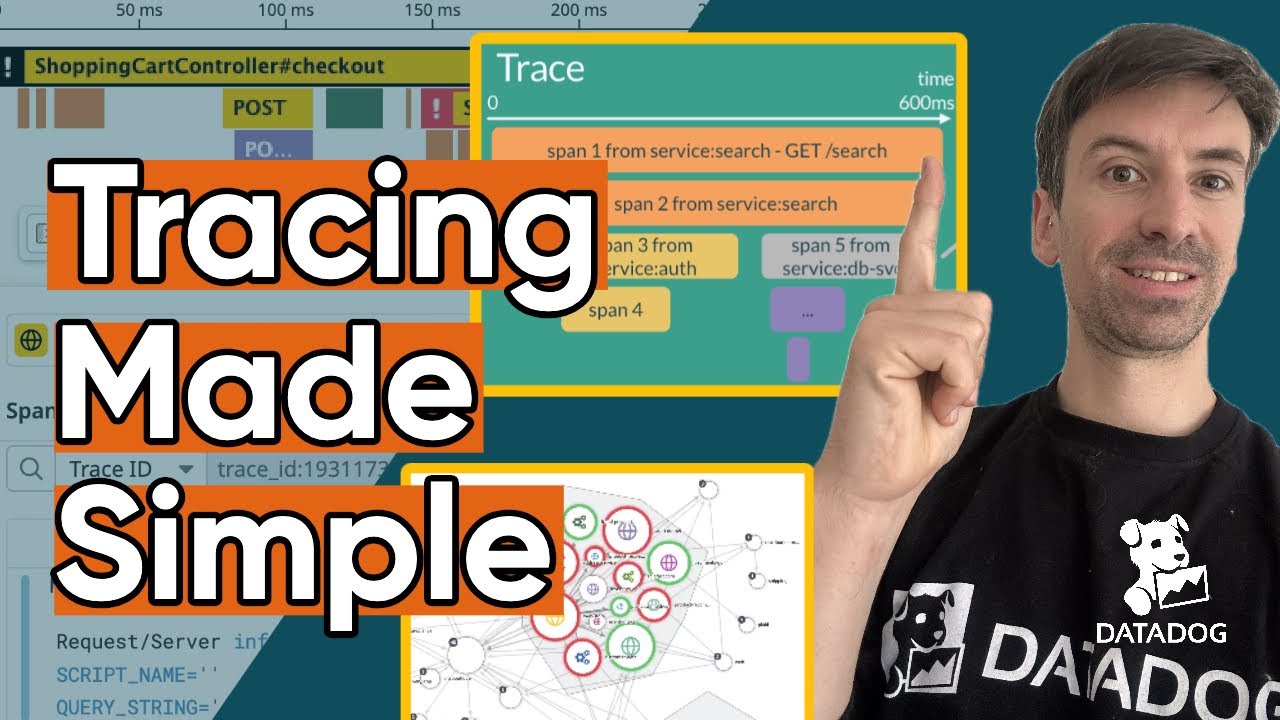
• What traces and spans really are (with easy-to-follow analogies)
• How Datadog collects, retains, and samples APM data
• The difference between ingested vs indexed spans
• How to build cost-effective sampling strategies
• Why APM metrics are key for long-term visibility and SLOs
• How the Service Catalog enables better ownership and system-wide insight
Whether you’re new to observability or trying to get serious about performance monitoring and cost control, this video gives you a solid foundation to build on.
👍 Like what you see?
✅ Subscribe for more dev tools & observability guides
💬 Drop a comment with your favorite APM tip or question
🚀 Explore our product: https://app.dataiker.com
📚 Visit our blog for deeper dives: https://blog.dataiker.com
#Datadog #APM #Observability #DevOps #Traces #Spans #Metrics #PerformanceMonitoring #SRE #Dataiker
Доступные форматы для скачивания:
Скачать видео mp4
-
Информация по загрузке:


