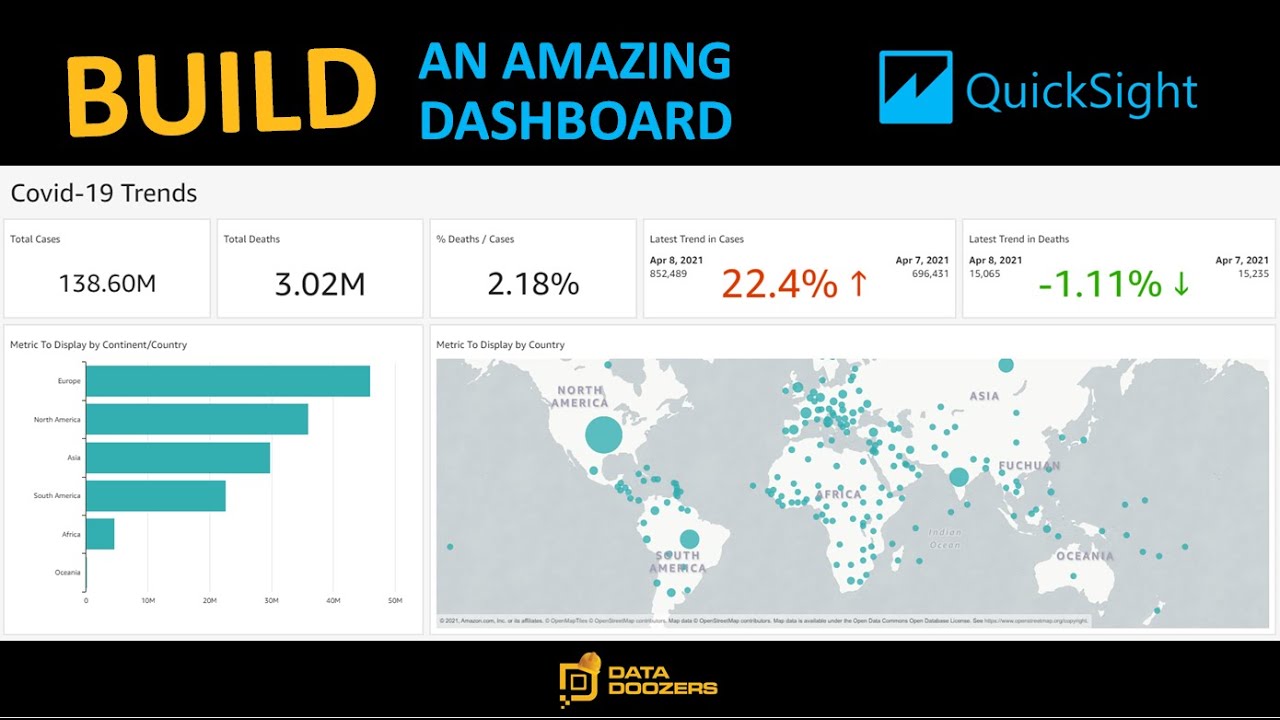
Building a dynamic Dashboard using AWS QuickSight
Автор: Data Doozers
Загружено: 2021-04-09
Просмотров: 67422
Whether you're new to Quicksight or have some experience using it, this video is for you. Use these public datasets to create a stunning Dashboard to analyze Covid-19 Data.
Find the resources here:
Covid-19 data: https://ourworldindata.org/coronaviru...
Coordinates by Country: https://gist.github.com/tadast/8827699
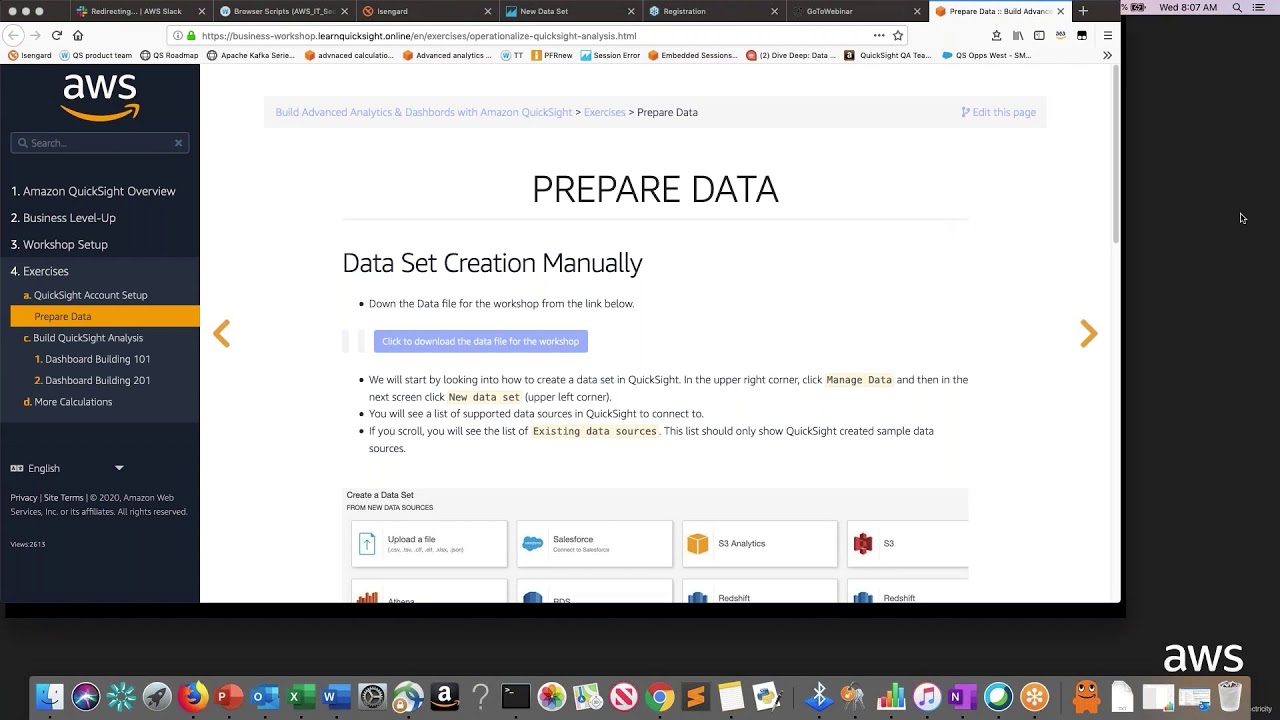
*You will need to join these data sources and perform some simple transformations to match the dataset we used in this video. Check this video in the Data Doozers channel to learn about it: • Data Prep with AWS QuickSight
Do you want to be a Data hero with Quicksight?. Check our Hands-on Course on Udemy:
https://www.udemy.com/course/the-comp...
Доступные форматы для скачивания:
Скачать видео mp4
-
Информация по загрузке:


![AWS Glue Tutorial for Beginners [FULL COURSE in 45 mins]](https://imager.clipsaver.ru/dQnRP6X8QAU/max.jpg)