Скачать
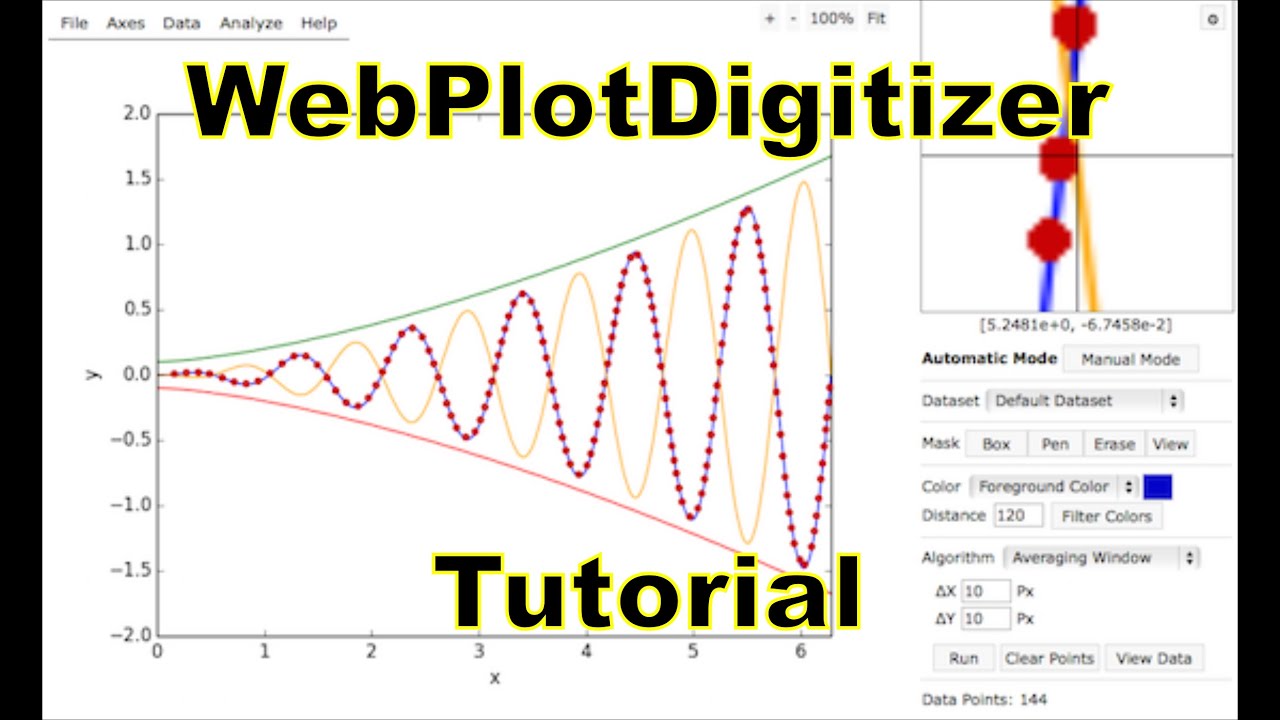
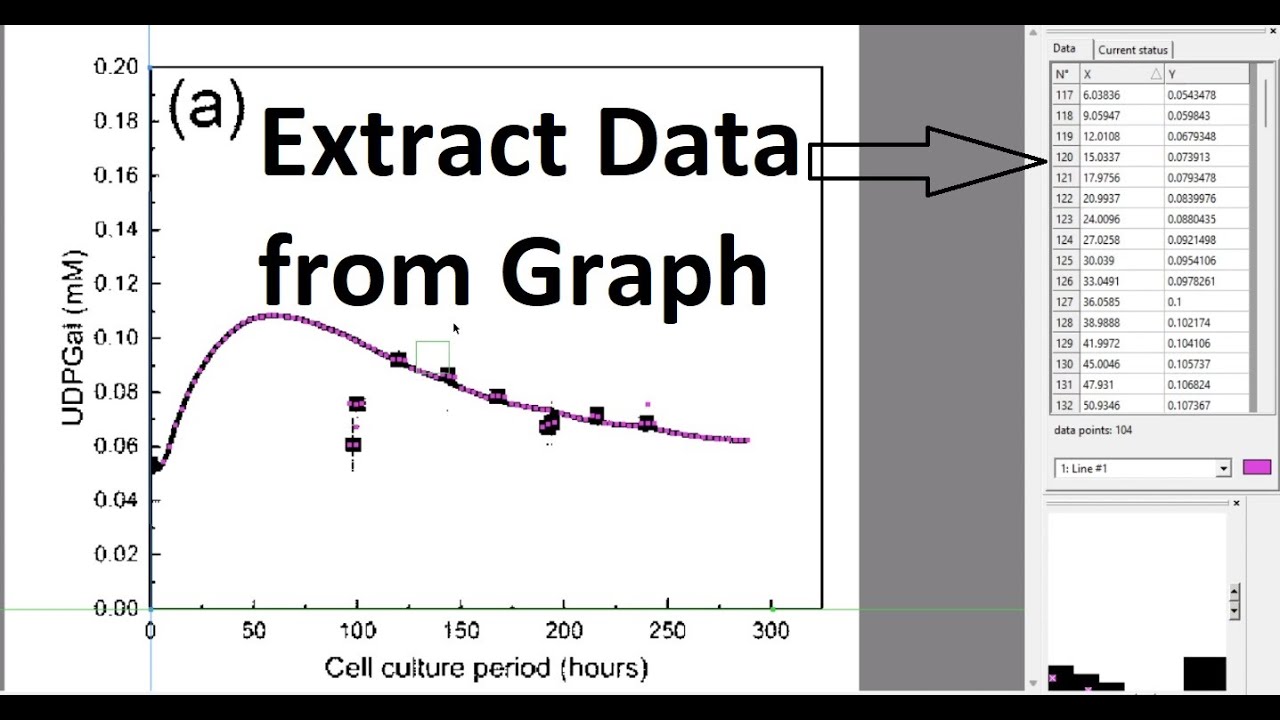
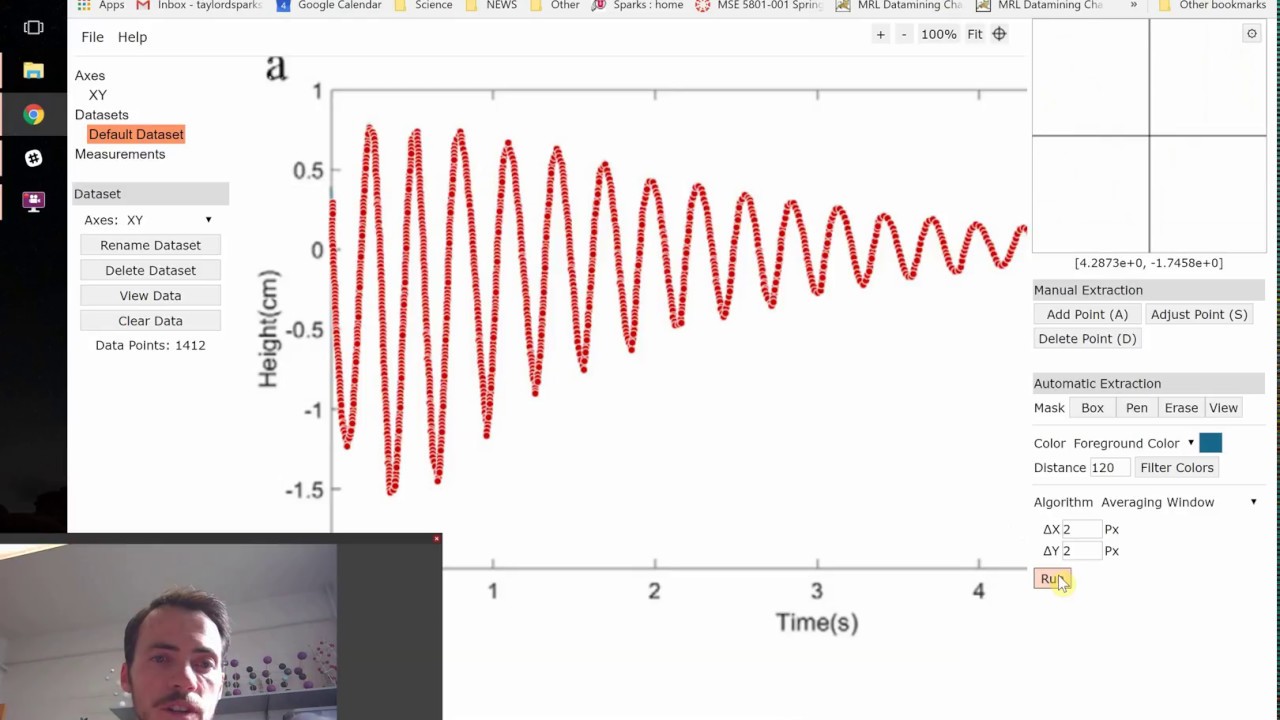
Tutorial of WebPlotDigitizer
Автор: Taylor Sparks
Загружено: 2018-04-04
Просмотров: 77407
Описание:
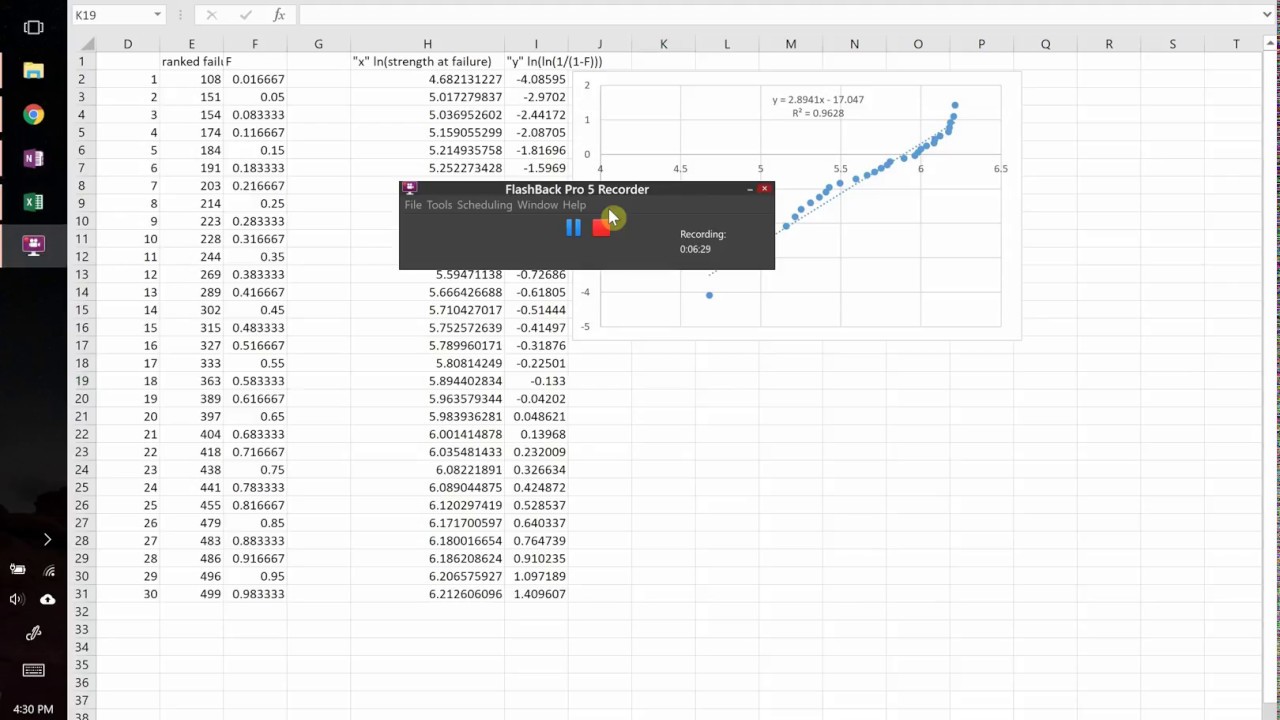
Tutorial example of how to capture data from a publication figure either manually or in automatic mode. How to save a project and load it later, and how to only collect data in certain regions.
Credit to the software creator, Dr. Ankit Rohatgi, who developed this software and freely distributed it. You can check out his own tutorials for it here https://github.com/ankitrohatgi/Websi... • PLOTCON 2017: Ankit Rohatgi, Reverse engin... • WebPlotDigitizer Tutorial 3.6+ (Watch at 7...
Доступные форматы для скачивания:
Скачать видео mp4
-
Информация по загрузке: