3 Simple Tips to Avoid Overplotting in R
Автор: Statistics Globe
Загружено: 2023-04-19
Просмотров: 3335
This is the very first YouTube Shorts video that was ever published on Statistics Globe! :) It would be amazing if you could let me know your feedback so that I can incorporate it in future videos. This video explains how to avoid overplotting in R programming using different functions and arguments of the ggplot2 library. Which topics would you like to see next?
R code of this video:
set.seed(75357)
data <- data.frame(
x = c(rnorm(1000),
rnorm(1000, 5, 2),
rnorm(1000, 1, 3)),
y = c(rnorm(1000),
rnorm(1000, 1, 4),
rnorm(1000, 2, 2)),
group = rep(LETTERS[1:3],
each = 1000))
library("ggplot2")
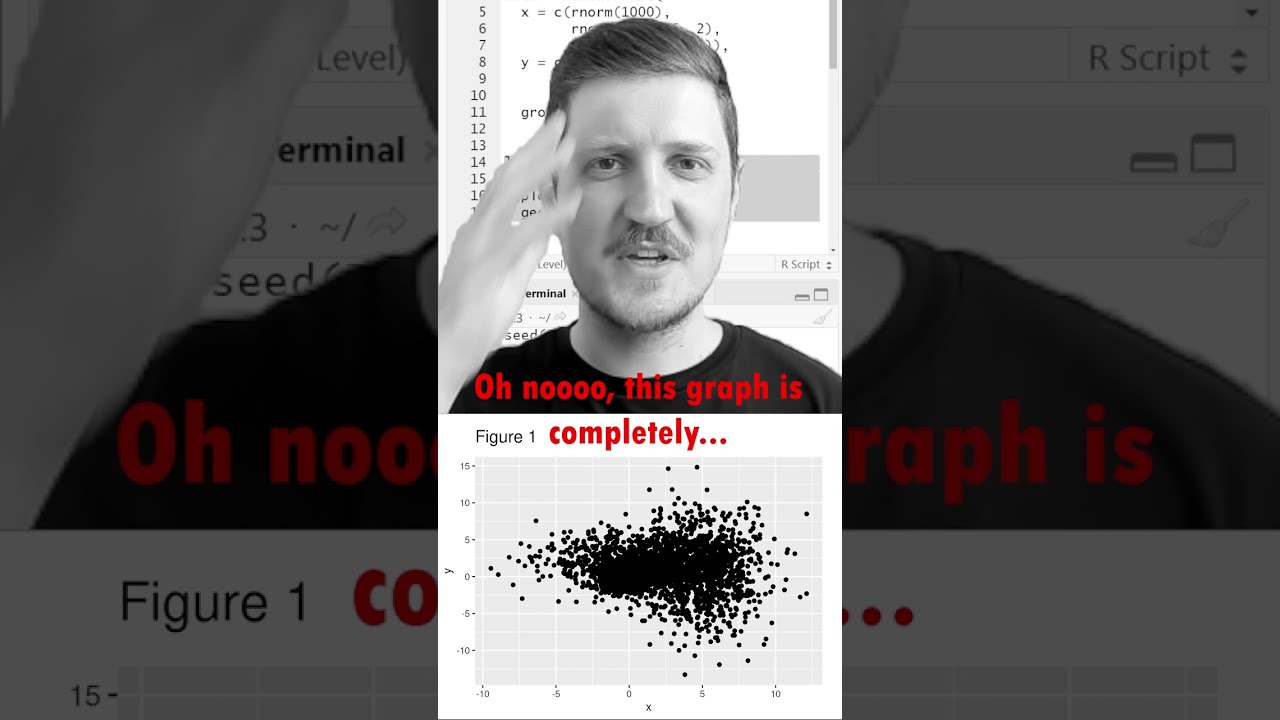
ggplot(data, aes(x, y)) +
geom_point()
ggplot(data, aes(x, y)) +
geom_point(size = 0.01)
ggplot(data, aes(x, y)) +
geom_point(alpha = 0.1)
ggplot(data, aes(x, y,
col = group)) +
geom_point()
ggplot(data, aes(x, y,
col = group)) +
geom_point(size = 0.05,
alpha = 0.2)
Follow me on Social Media:
Facebook – Statistics Globe Page: / statisticsglobecom
Facebook – R Programming Group for Discussions & Questions: / statisticsglobe
Facebook – Python Programming Group for Discussions & Questions: / statisticsglobepython
LinkedIn – Statistics Globe Page: / statisticsglobe
LinkedIn – R Programming Group for Discussions & Questions: / 12555223
LinkedIn – Python Programming Group for Discussions & Questions: / 12673534
Twitter: / joachimschork
Music by bensound.com
Доступные форматы для скачивания:
Скачать видео mp4
-
Информация по загрузке:


