How to Create a Sales Pipeline Analysis Interactive Dashboard in Power BI || Step-by-Step Tutorial
Автор: The Data Science Studio
Загружено: 2025-02-03
Просмотров: 2787
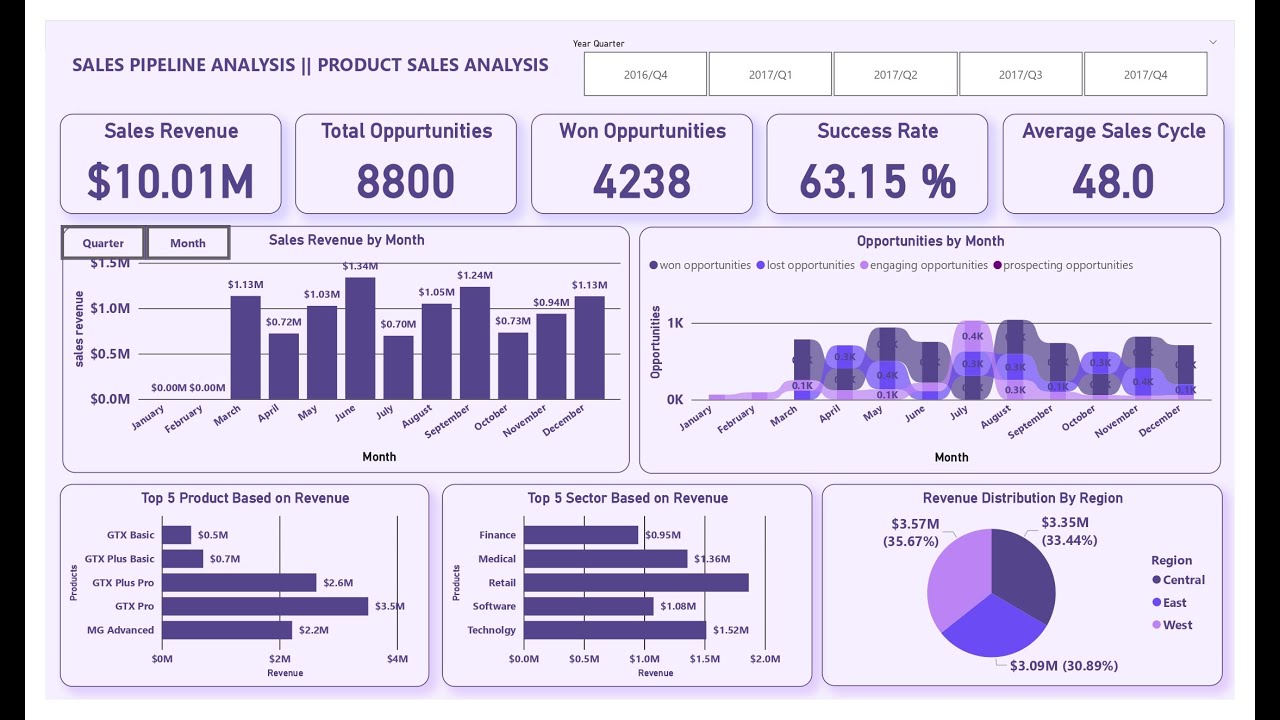
In this comprehensive tutorial, we'll walk you through how to create an interactive sales pipeline analysis dashboard using Power BI. Whether you're a beginner or looking to refine your Power BI skills, this video will guide you through the essential steps.
What you'll learn in this tutorial:
Theoretical Overview: Understand the concepts behind sales pipeline analysis, key performance indicators (KPIs), and how they help drive business decisions.
Building Visuals: Learn how to use Power BI’s powerful visualization tools to create interactive charts, graphs, and tables that represent your sales data effectively.
KPIs and Metrics: Discover the key sales metrics to track in your pipeline, such as conversion rates, deal size, and sales velocity, and how to visualize them in your dashboard.
Creating an Interactive Dashboard: See how to integrate slicers, drill-through features, and dynamic visuals that allow you to interact with the data in real time.
By the end of this tutorial, you'll be equipped with the knowledge to build your own sales pipeline dashboard in Power BI, track your KPIs, and make data-driven decisions with ease!
Dataset (PBIX File) : https://drive.google.com/drive/folder...
Make sure to like, comment, and subscribe for more data analysis tutorials!
#PowerBI
#SalesPipeline
#DataAnalysis
#BusinessIntelligence
#DashboardDesign
#SalesAnalytics
#KPIs
#DataVisualization
#SalesDashboard
#PowerBIDashboard
#PowerBItutorial
#BusinessDashboards
#PowerBIFeatures
#SalesPerformance
#DataDriven
#DataReporting
#PowerBIForBeginners
#PowerBICharts
#DataInsights
#SalesManagement
#SalesReporting
#InteractiveDashboard
#SalesTracking
#PowerBIDashboardDesign
#DataVisualizationTools
#SalesMetrics
#PowerBITips
#DataModels
#BusinessAnalytics
#SalesData
#PowerBIAnalysis
#KPITracking
#DataVisualizationTips
#BusinessIntelligenceTools
#PowerBIPowerTips
#SalesFunnel
#DataTools
#PowerBITableau
#VisualizationDesign
#AnalyticsDashboard
#PowerBISolutions
#PowerBITraining
#ExcelToPowerBI
#SalesKPI
#PerformanceMetrics
#SalesDataAnalysis
#DataVisualizationDesign
#SalesForecasting
#BusinessIntelligenceDashboard
#PowerBIData
#BusinessAnalysis
#DataVisualizationPlatform
#InteractiveData
#DashboardTutorial
#SalesPipelineAnalysis
#PowerBIDashboards
#DataAnalysisTools
#PowerBIBeginner
#KPIAnalysis
#BIReporting
#DataAnalyticsDashboard
#PowerBIDashboardTutorial
#SalesInsights
#SalesDataVisualization
#BusinessIntelligenceReporting
#PowerBICustomVisuals
#DataAndAnalytics
#BusinessKPI
#PowerBITrainingForBeginners
#VisualizationTips
#PowerBIDashboardTips
#SalesReportingTools
#PowerBIViz
#BusinessReporting
#DataVisualizationInPowerBI
#SalesPerformanceDashboard
#PowerBIForBusiness
#PowerBIVisualizations
#InteractiveCharts
#PowerBIForSales
#DataScienceTools
#SalesForecast
#SalesTrends
#BusinessGrowth
#SalesMetricsTracking
#PowerBIInsights
#BusinessIntelligencePlatform
#SalesReportingDashboard
#AnalyticsAndDashboards
#PowerBIForExecutives
#PowerBIDashboardVisualization
#PipelineAnalytics
#BusinessDataAnalysis
#PowerBIReport
#SalesFunnelMetrics
#PowerBILearning
#SalesPerformanceAnalysis
#BusinessIntelligenceTutorial
#SalesPipelineManagement
#PowerBIProject
Доступные форматы для скачивания:
Скачать видео mp4
-
Информация по загрузке:


