Day 2: Data Visualization Tools Explained | Tableau & Power BI for Beginners
Автор: TopicExplainer
Загружено: 2026-01-16
Просмотров: 13
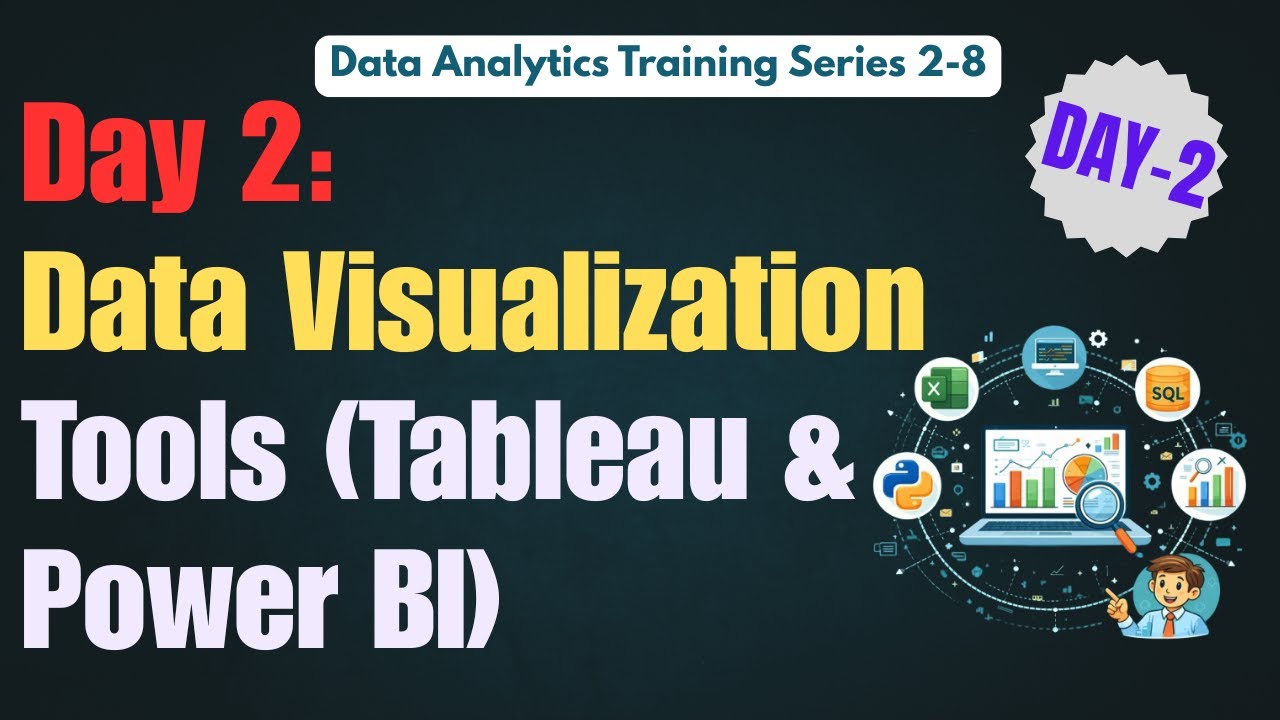
In this video, we move from understanding what Data Analytics is to how insights are actually presented using Data Visualization tools.
You’ll learn how tools like Tableau and Power BI help transform thousands of rows of raw data into clear charts, graphs, and dashboards that drive decision-making.
In This Video, You’ll Learn:
✔ What Data Visualization is and why it matters
✔ Introduction to Tableau and Power BI
✔ Types of charts used in Data Analytics
✔ How dashboards help tell data stories
✔ Real-world use of data visualization tools
By the end of this video, you’ll understand how data visualization works and why Tableau & Power BI are must-have tools for data analysts.
👍 Like | 🔔 Subscribe | 📤 Share with learners who want to grow in Data Analytics
Note: If anyone has any queries about the content, please leave a comment. This channel is for "EVERYONE" who wants to learn.
Note: All images are AI-generated and used only for illustrative purposes. They do not represent any real person, event, or location.
Disclaimer: This video is just intended to be informative and does not intend to infringe upon any Google or YouTube community standards or guidelines. I respect and abide by all Google and YouTube terms and conditions.
#datavisualization
#tableau
#powerbi
#dataanalytics
#analyticstraining
#dataanalyst
#dashboarddesign
#learndataanalytics
Доступные форматы для скачивания:
Скачать видео mp4
-
Информация по загрузке:


