Скачать
⚡𝗕𝘂𝗶𝗹𝗱 𝗮𝗻 𝗜𝗻𝘁𝗲𝗿𝗮𝗰𝘁𝗶𝘃𝗲 𝗘𝘅𝗰𝗲𝗹 𝗗𝗮𝘀𝗵𝗯𝗼𝗮𝗿𝗱 𝗦𝘁𝗲𝗽-𝗯𝘆-𝗦𝘁𝗲𝗽 | 𝗣𝗶𝘃𝗼𝘁 𝗧𝗮𝗯𝗹𝗲𝘀, 𝗖𝗵𝗮𝗿𝘁𝘀 & 𝗖𝗼𝗻𝗱𝗶𝘁𝗶𝗼𝗻𝗮𝗹 𝗙𝗼𝗿𝗺𝗮𝘁𝘁𝗶𝗻𝗴 ⚡
Автор: Learn with Elen 📖📚
Загружено: 2026-01-19
Просмотров: 24
Описание:
Hello and a very good day everyone,
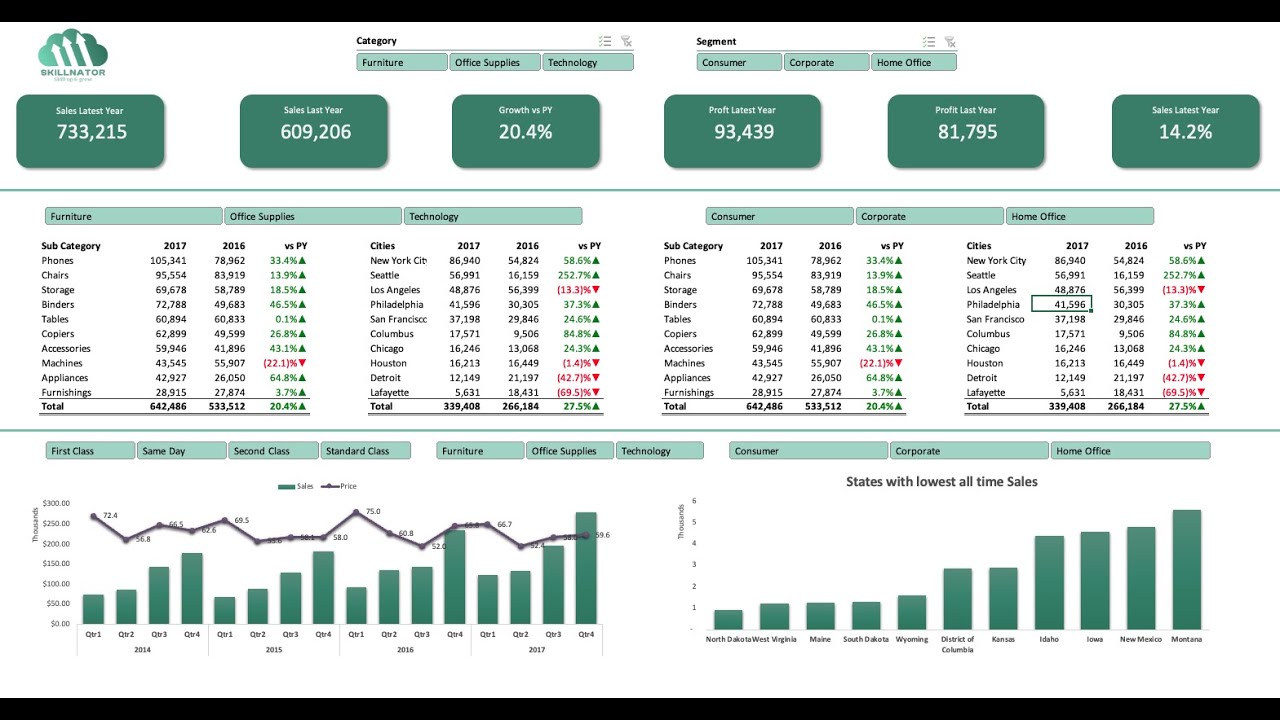
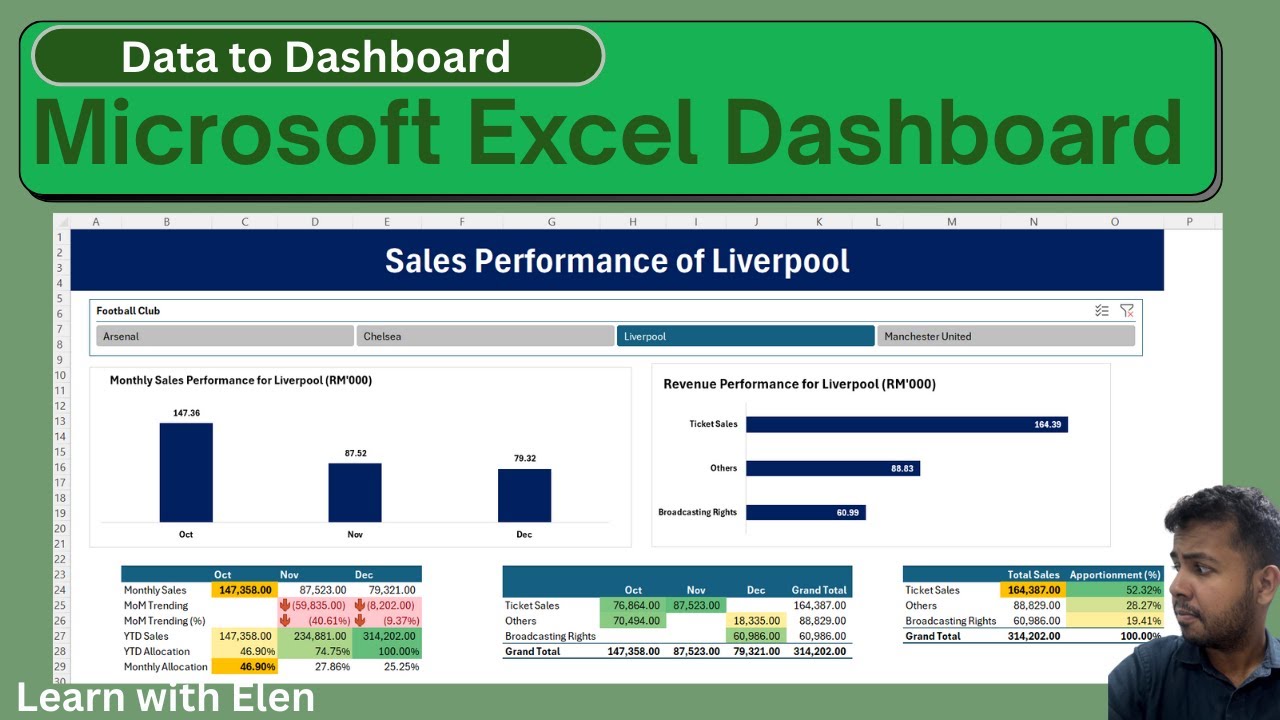
In this #post, I shared how to build a clean, professional, and interactive Excel dashboard using sales data.
Basically, this is a 25-minute Excel Dashboard tutorial where I segregate to several parts.
🔍 What you will learn in this video:
✔ Creating Pivot Tables to summarize sales data
✔ Building Pivot Charts (Column & Bar Charts)
✔ Using Slicers for interactive filtering
✔ Applying Conditional Formatting to highlight trends and performance
✔ Using essential Excel formulas such as:
Feel #free to #view the #video.
Should you #have any #questions, feel #free to #ask in the #comments section.
Доступные форматы для скачивания:
Скачать видео mp4
-
Информация по загрузке: