How to Build a Waterfall Chart in Tableau
Автор: Intellezy Learning
Загружено: 2021-06-02
Просмотров: 694
In this micro-lesson you will learn how to:
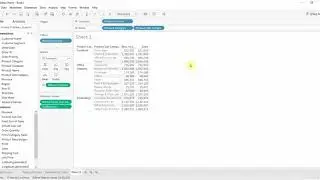
Understand what Waterfall Charts are
Create Waterfall Charts
Full Course Description: This course introduces advanced topics designed to push report creators past the basic menu choices. Sets, Parameters, and LOD expressions work to provide analysts with answers to questions - answers that could not be found any other way. More sophisticated visualizations are built and then used on interactive dashboards that let users control what they see.
With over 10,000 training videos available for desktop applications and business skills that comprise hundreds of courses, our learning and development consultants can quickly and precisely develop training modules to support your needs. Our video content is engaging and offers assessments that can be used to test knowledge levels pre and/or post-course. Video content is currently accessible in 20 languages through closed caption translations on our world-class learning portal or on your own SCORM-compliant learning management system, affordably meeting the needs of your global workforce. You can access our full course and thousands of others by registering for our eLearning Training library.
Learn more about our training: https://bit.ly/33MEtDg
If you found this microlesson helpful, subscribe to our channel to be notified when we upload new videos every Tuesday and Thursday: https://bit.ly/3KB48Sm

Доступные форматы для скачивания:
Скачать видео mp4
-
Информация по загрузке: