Lesson 104: Why We Use the Bell Curve: Making Sense of Data Through Descriptive Statistics?
Автор: Geneva Tutoring NCMHCE CPCE NCE (PhD Student)
Загружено: 2025-10-30
Просмотров: 12
📈 Description:
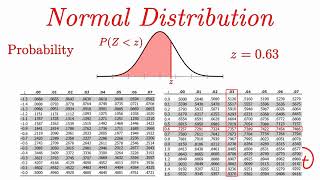
In this video, we connect everything we’ve covered so far — the normal distribution, skewed curves, and the 68–95–99.7 rule — to the bigger picture: why we use descriptive statistics to explain data.
You’ll learn how descriptive statistics help us:
🔹 Summarize large sets of data into clear patterns
🔹 Understand where most people fall on the curve (like with IQ scores)
🔹 Describe variation and performance without bias
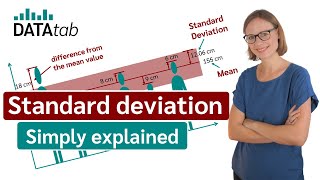
🔹 See how averages and spread tell the story behind the numbers
This video lays the groundwork for upcoming lessons where we’ll dive deeper into z-scores, percentiles, and interpreting results in research and exams.
💜 Geneva Tutoring Prep, where confidence meets preparation.
#BellCurve #descriptivestatistics #counselingexamprep #IQScores #GenevaTutoring #DataMadeSimple #research #nce #cpce #studyguide

Доступные форматы для скачивания:
Скачать видео mp4
-
Информация по загрузке: