Ultimate Guide: Installing Prometheus and Grafana in UnRaid for Stunning Dashboards!
Автор: MadTc Tech
Загружено: 2024-03-03
Просмотров: 6501
In this tutorial, we'll show you how to set up an incredible dashboard on UnRaid using Grafana and Prometheus. Follow along as we utilize a tutorial from the UnRaid blog to create Docker containers for generating breathtaking visualizations and insightful data analysis. Learn how to effortlessly install Prometheus and Grafana within UnRaid's Docker section, alongside the Prometheus Node Exporter plugin for capturing logs. Don't miss out on creating your own impressive dashboard!
---------------------------------------------------
Credit to this Blog: https://unraid.net/blog/prometheus
---------------------------------------------------
* UPDATED FILE LOCATION:*
Yaml File: https://gitlab.com/MadTcTutorials/pro...
---------------------------------------------------
Support The Channel
---------------------------------------------------
Affiliate:
Robinhood: Join Robinhood with my link and we'll both pick our own free stock 🤝 https://join.robinhood.com/travisb-70...
CHAPTERS
---------------------------------------------------
00:00 Intro
00:41 Download Grafana
01:46 Prometheus
02:22 Promethius Node Exporter
02:44 Configure the yaml
04:24 Start Prometheus
04:32 Open up and Configure Prometheus
05:12 Open and Configure Prometheus in Grafana
06:35 Import Dashboards
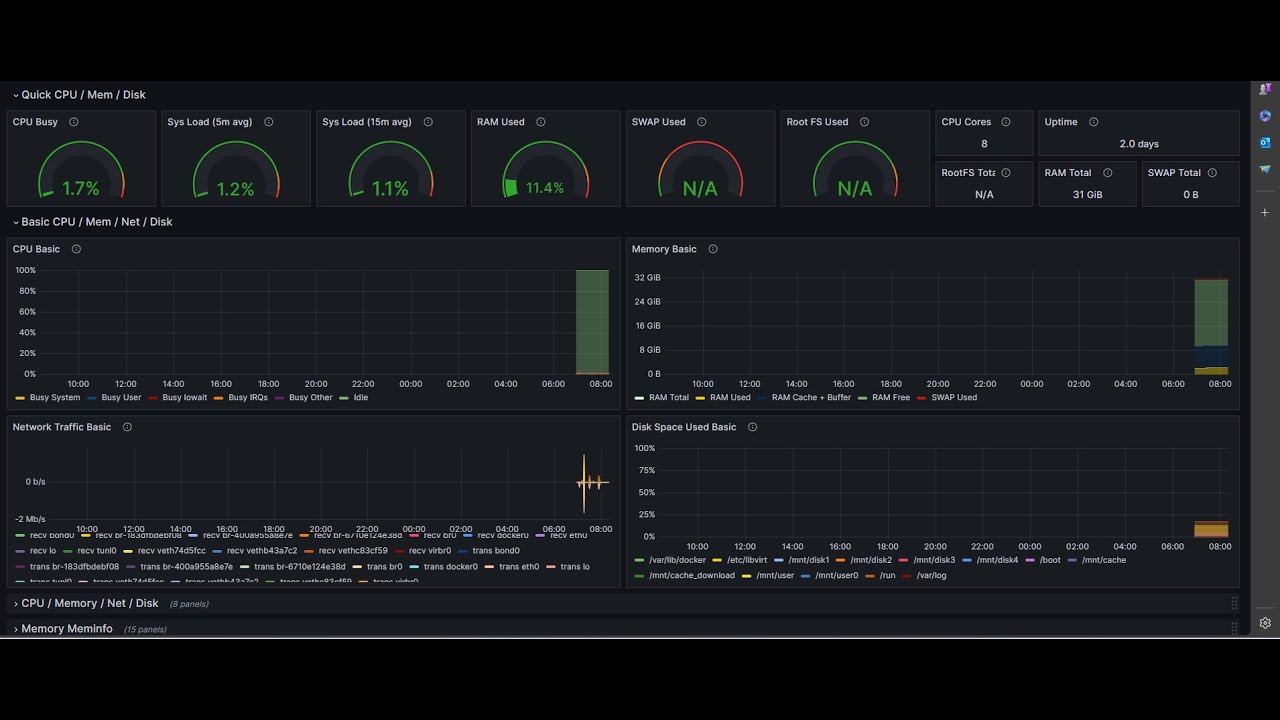
08:14 The Nice Dashboard
09:09 Like and Subscribe
#UnRaid #Grafana #prometheus
Доступные форматы для скачивания:
Скачать видео mp4
-
Информация по загрузке: