How to Calculate and Draw Ombrothermic Chart | Sanjib Mandal | SanGeotics
Автор: SanGeotics
Загружено: 2019-10-18
Просмотров: 4017
Ombrothermic Chart: (All Knowledge including Video and audio Recording and Editing done By Sanjib Mandal, If the video will helpful to You then plz Like and SUBSCRIBE the channel)
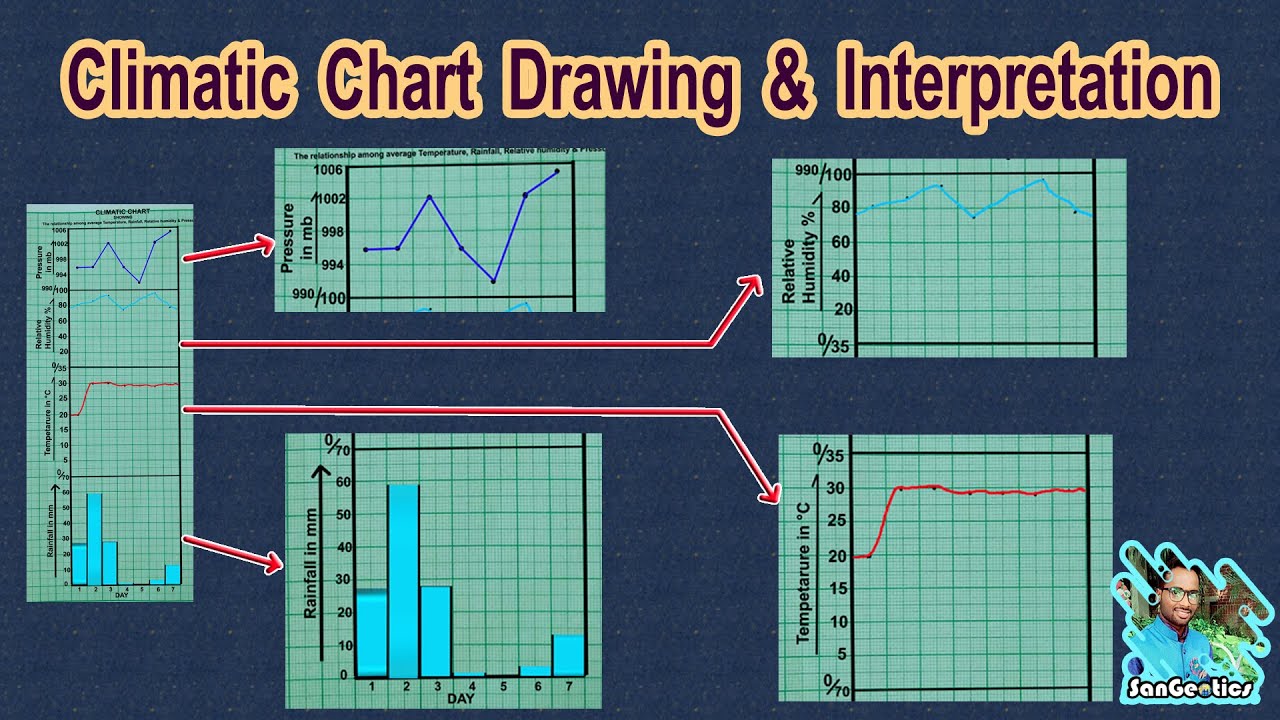
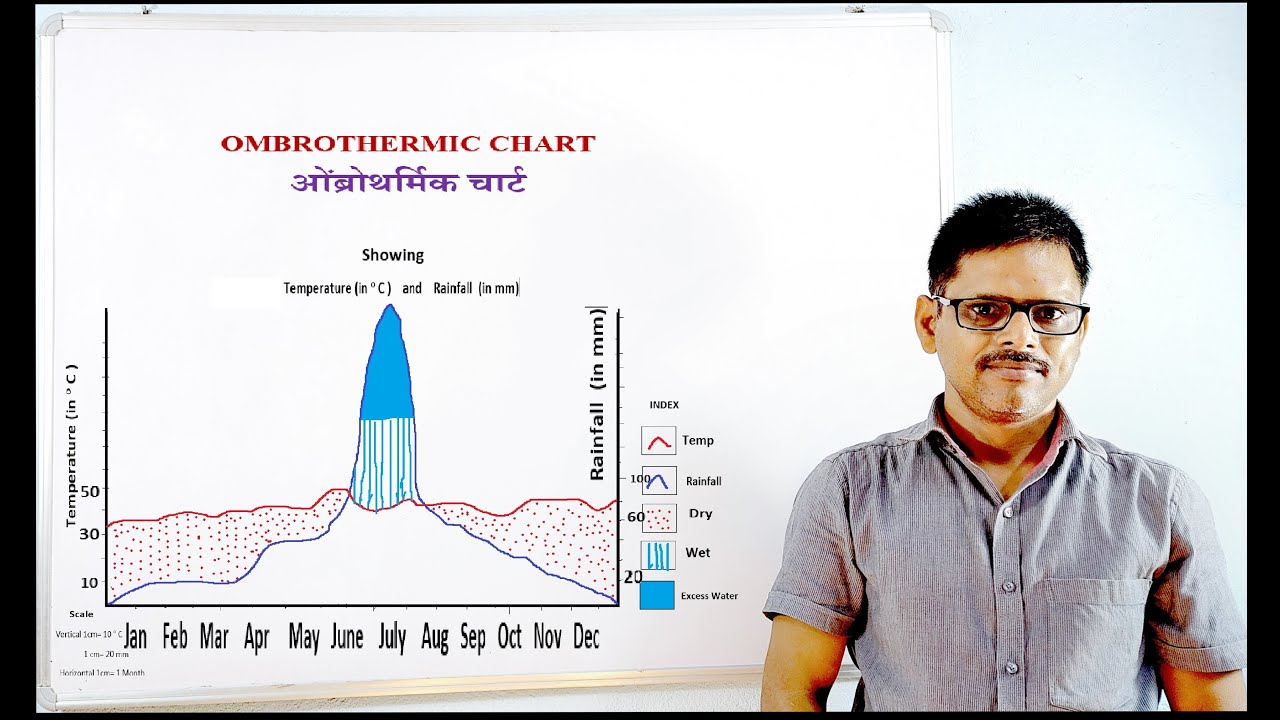
Ombrothermic Chart are diagrams that summarize trends in temperature and precipitation for at least 30 years. They allow to establish the relationship between temperature and precipitation and to determine the length of dry, wet, and extremely wet periods.
Ombrothermic diagram also called as Walter Lieth diagram is one such climatic diagram used to compare the average wetness and dryness for an area of interest. The data must be average for nearly thirty years.
• On graph paper ofno normal white paper, draw the x-axis marking each of the months starting with the coldest month. Remember to start in January if you are plotting data collected in the northern hemisphere or in July if the data is from the southern hemisphere.
• Label the months on the x-axis.
• Draw two y axes one for temperature in degree Celsius and another for rainfall in mm.
• The scale must be chosen in such a way that line marking 10°C should be equal to 20 mm of rainfall in the other axis. Rainfall scale should be twice the value of temperature scale selected.
• Draw a graph with red colour corresponding to the temperature data.
• Draw a graph with blue colour corresponding to the rainfall data.
• When the temperature line runs above the precipitation line there is a dry season and the area between the lines should be illustrated by filling it with dots
• When the temperature line runs below the precipitation line there is a wet season and the area between the lines should be illustrated by filling it with vertical lines
• There is a practice of colouring the portions which exceed 100 mm, precipitation as a period with excess water with blue colour.
Inference: The station has the dry season between September and June; wet season from July to August and excess water same as wet period.

Доступные форматы для скачивания:
Скачать видео mp4
-
Информация по загрузке: