Скачать
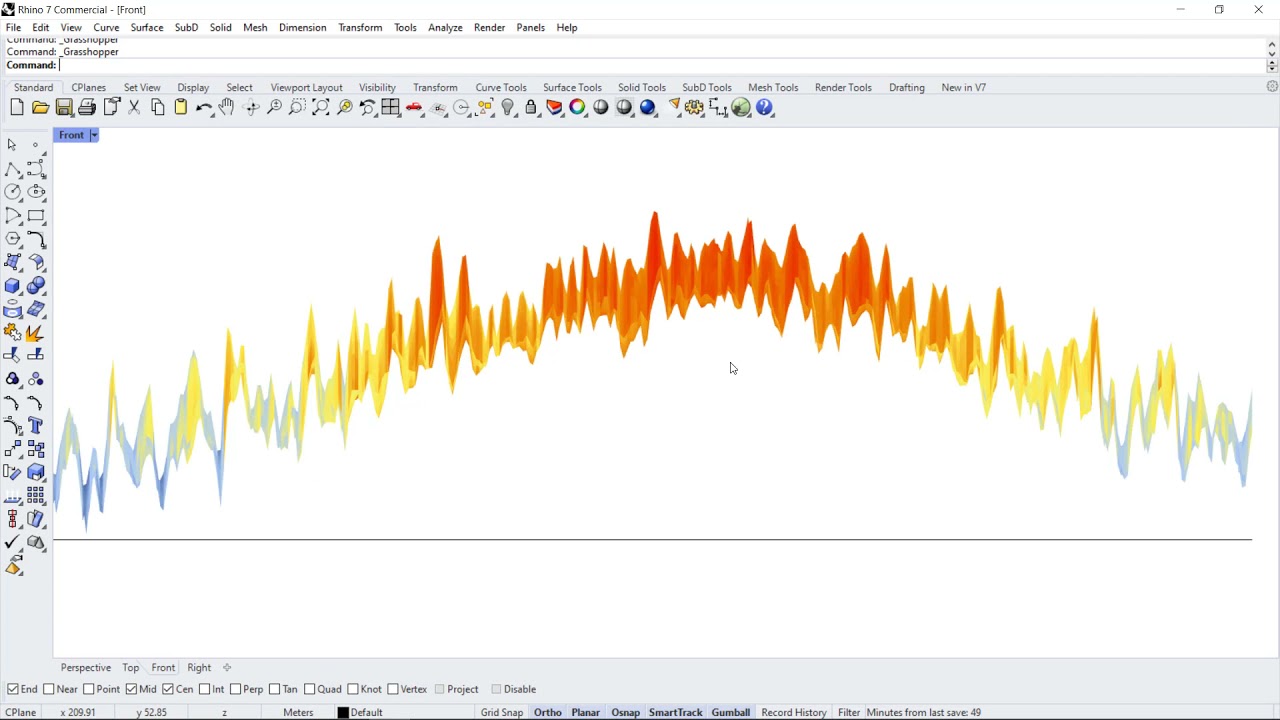
Hourly and Monthly Chart
Автор: Ladybug Tools
Загружено: 2022-03-24
Просмотров: 8459
Описание:
Learn how to use the Hourly Plot and Monthly Chart components to visualize weather data like dry-bulb temperature, relative humidity, and much more.
Доступные форматы для скачивания:
Скачать видео mp4
-
Информация по загрузке:


![[Tutorial] UTCI outdoor thermal comfort](https://image.4k-video.ru/id-video/d5gFvfeUS-g)

![Honeybee V1.4 :: Photovoltaic Panels [Tutorial 3.6]](https://image.4k-video.ru/id-video/L9gwwiV7IHY)


