Behind the scenes of the FT's coronavirus tracker | John Burn-Murdoch
Автор: Hacks/Hackers LDN
Загружено: 2020-04-23
Просмотров: 680
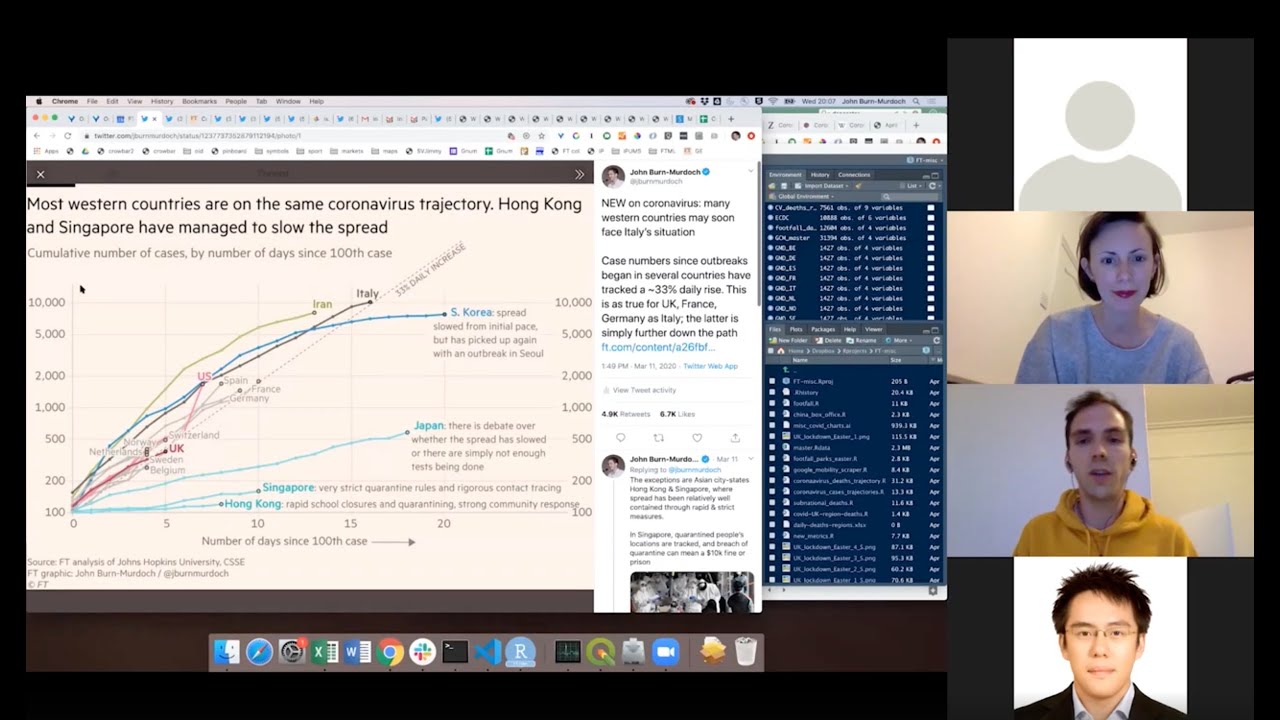
The Financial Times's daily-updated coronavirus tracker graphics have become a Twitter sensation and a must-read for anyone wanting to keep up with how the pandemic is progressing globally.
Senior data-visualisation journalist John Burn-Murdoch explains the process behind making and updating the charts, the data and design choices that were made, and how he engaged and collaborated with readers to iterate and improve the charts.
This video was recorded on 15/04/2020
Video by Iliana Mavrou
🗓Join the next Hacks/Hackers London meeting: https://www.eventbrite.co.uk/o/hacksh...
Hacks/Hackers London is a community of journalists and technologists. Our members work with code, build tools for news-gathering, start companies, write and record stories, crunch data, break news, subvert distribution, study audiences, share knowledge, chase baddies, and chat.
We meet every month to explore the future of journalism and tech. Find out more here: https://www.hackshackersldn.co.uk/
🐦Follow us on Twitter: / hackshackersldn
💼Follow our LinkedIn page: / hacks-hackers-london
📚Read our articles on Medium: / hacks-hackers
📺Subscribe to our channel: / @hackshackersldn1800
Доступные форматы для скачивания:
Скачать видео mp4
-
Информация по загрузке: