Labelling gene clusters using Artemis's DNAPlotter software.
Автор: Genome Projects
Загружено: 2021-01-05
Просмотров: 4063
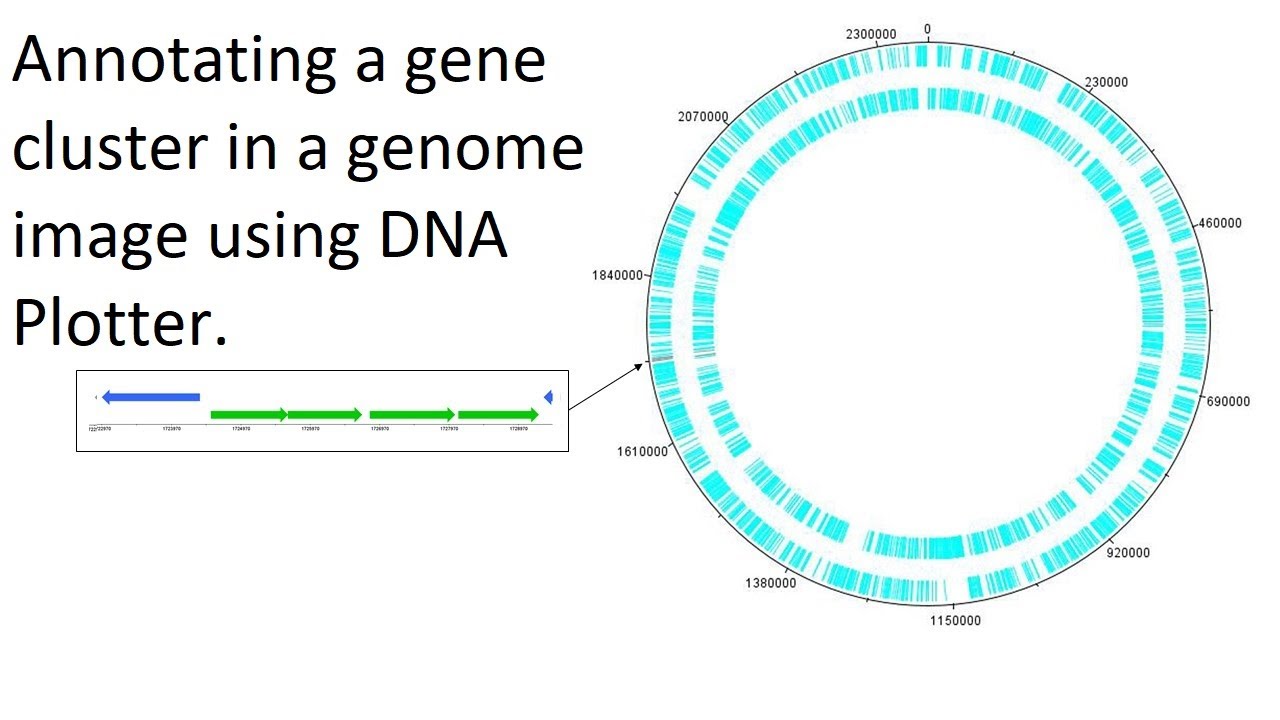
DNAPlotter is a tool that allows circular and linear interactive genome visualization.
The software can be used to generate images of circular and linear DNA maps to display regions and features of interest.
This video provides a quick guide to producing an image / figure of a bacterial genome using the Artemis DNAPlotter tool. The video also shows how to make lovely images of the genome highlighting regions of interest. This might be useful for anyone starting out using DNAPlotter or for students who need figures for presentations or reports etc...
I have used DNA Plotter in this video to visualise a whole genome and highlight a cluster of genes.
You can read more about this software at:
DNAPlotter: circular and linear interactive genome visualization. Carver T, Thomson N, Bleasby A, Berriman M and Parkhill J. Bioinformatics (Oxford, England)
Доступные форматы для скачивания:
Скачать видео mp4
-
Информация по загрузке:


