Скачать
📊 Alluvial Chart / Spaghetti Plot in Power BI using Deneb
Автор: brunobattaglia
Загружено: 2026-01-08
Просмотров: 18
Описание:
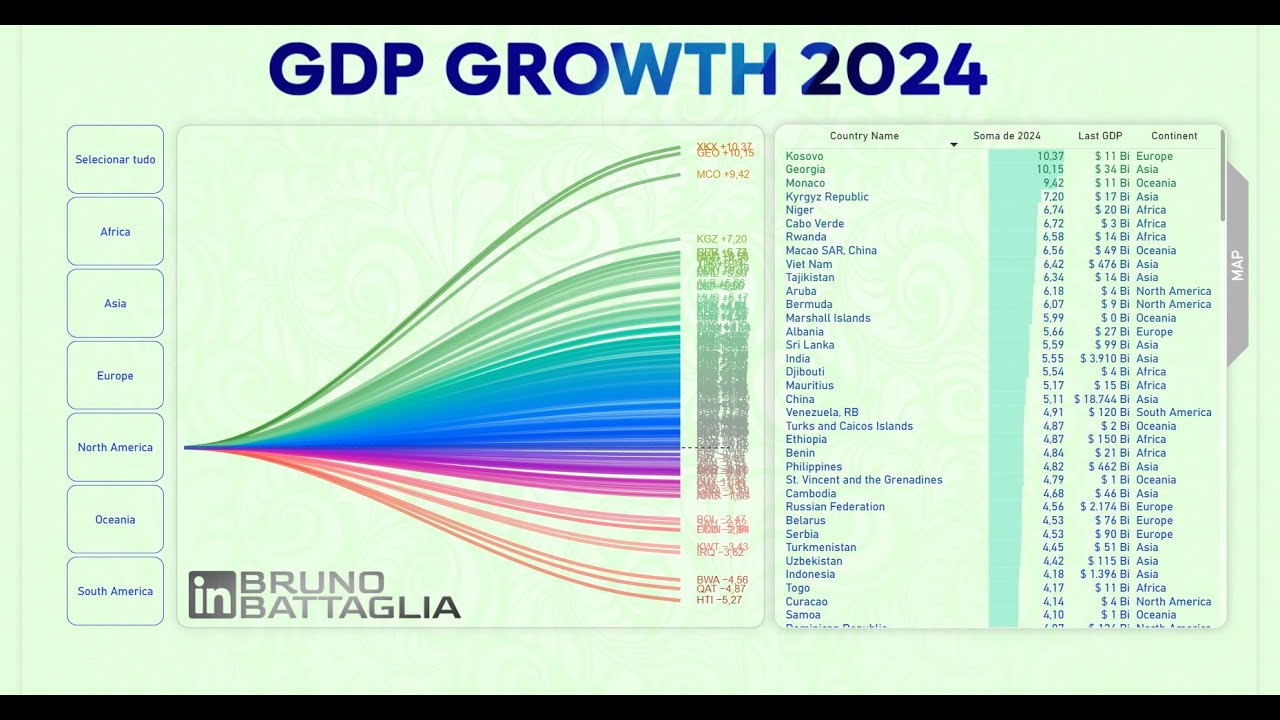
I created a customized chart to visually analyze large datasets and focus on overall patterns rather than details.
Conclusions:
This kind of chart works best with a predefined data range, like an NPS evaluation, which goes from –100 to +100.
It doesn’t work very well when outliers are present, since extreme values tend to flatten the other lines and reduce the chart’s usefulness.
Take a look at it: https://lnkd.in/eiuWb-s3
#PowerBI #Deneb #DataVisualization #Analytics #DataStorytelling
Доступные форматы для скачивания:
Скачать видео mp4
-
Информация по загрузке:


