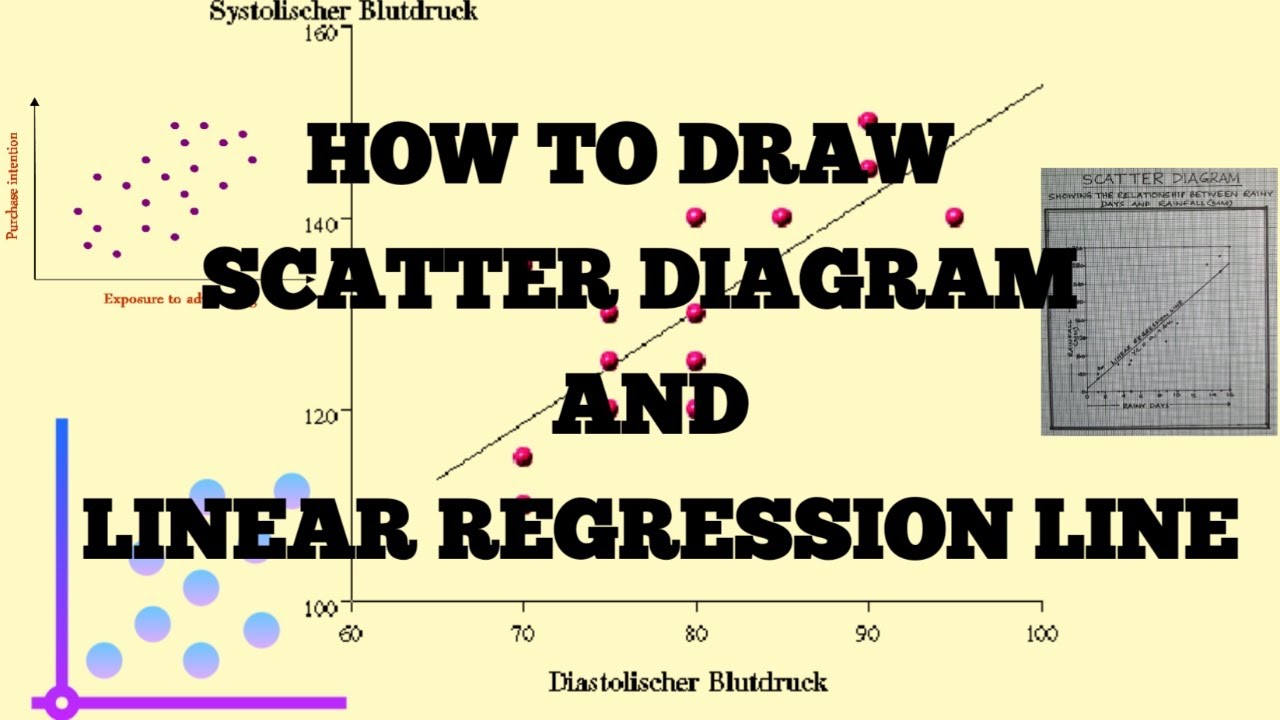
How to Draw Scatter Diagram and Linear Regression Line।
Автор: GEO FUNDA
Загружено: 2020-11-05
Просмотров: 10472
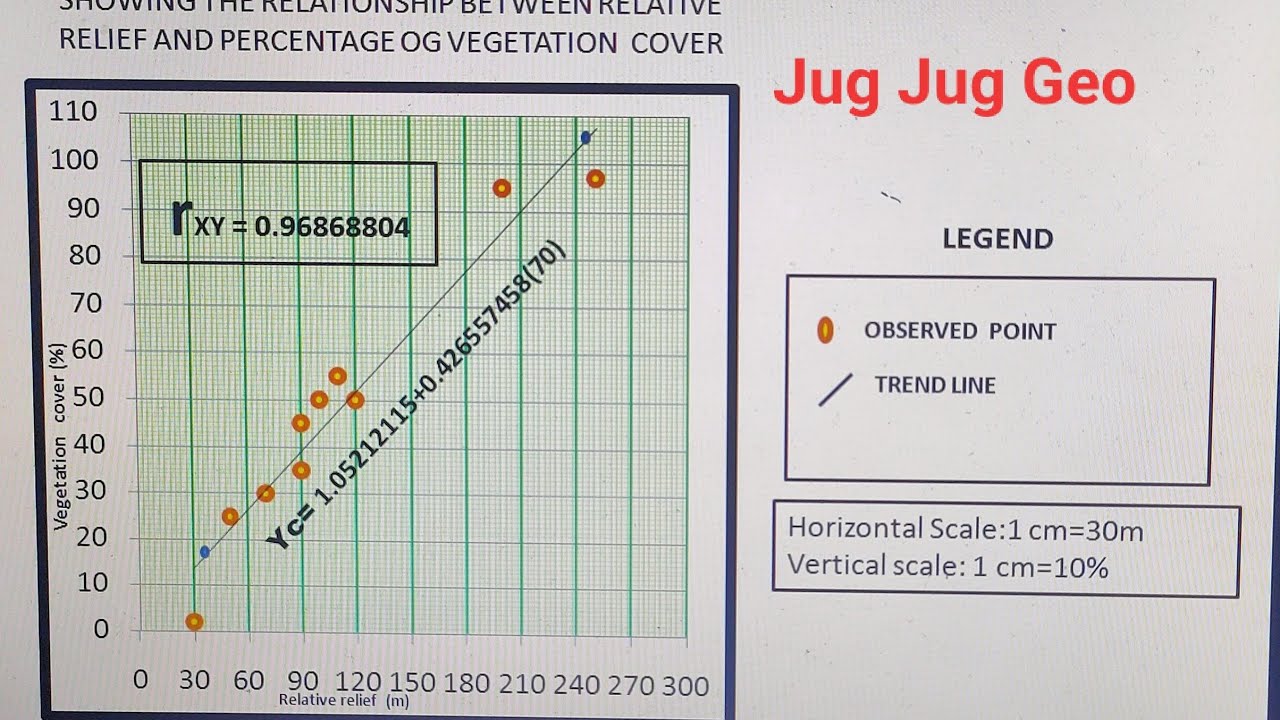
This video is How to Draw Scatter Diagram and Linear Regression Line is made by Geo Funda. A scatter diagram is a type of mathematical diagram using cartesian coordinates to display values for typically two variables for a set of data.
A scatter diagram in statistics can be used either when one continuous variable is under the control of the experimenter and the other depends on it or when both continuous variables are independent. If a parameter exists that is systematically incremented and or decremented by the other, it is called the control parameter or independent variable and is customarily plotted along the horizontal axis. The measured or dependent variable is customarily plotted along the vertical axis.
In statistics, a linear regression line is a linear approach to modeling the relationship between a scalar response (or dependent variable) and one or more explanatory variables (or independent variables). The case of one explanatory variable is called simple linear regression. For more than one explanatory variable, the process is called multiple linear regression.
#scatter_diagram #linear_regression_line #By_Geo_Funda
The link to my channel .....
/ @geofunda
Geography Fundamental Facebook Page Link...
/ geography0007
The video link of Hythergraph after G. Taylor ......
• Hythergraph after G Taylor ।। By Geo Funda
The video link of Transport Network Analysis by Detour Index ......
• Transport Network Analysis by Detour Index...
The link to the video How to Draw Band Graph .....
• How to Draw Band Graph।। স্তর লেখচিত্র।। B...
The video link of Climograph after G. Taylor .....
• Climograph after G Taylor ।। By Geo Funda
The video link of How to Prepare Flood in Sunderban Project Work for Class 12 in Bangla.....
• How to Prepare Flood in Sunderban Project ...
The link to the video How to Prepare Household Survey for Class 11 in Bangla ...
• How to Prepare Household Survey for Class ...
The link to the video How to Draw Wind Rose...
• How to Draw Wind Rose Diagram। By Geo Funda
How to Read Maximum and Minimum Temperature Thermometer...
• Maximum and Minimum Thermometer ll বায়ুর ...
How to Measure Relative Humidity by Hygrometer in Bangla .....
• How to Measure Relative Humidity by Hygrom...
Contact Me :
Email: geofunda025@gmail.com
Follow Me :
Facebook :
/ malay.maiti.969
Instagram :
https://www.instragram.com/maitimalay...
Twitter :
https://twitter.com/MalayKumarMai13?s=09
Доступные форматы для скачивания:
Скачать видео mp4
-
Информация по загрузке: