LEARN MQL5 TUTORIAL BASICS - 85 SIMPLE TAKE PROFIT POINT TEST
Автор: MQL5 Tutorial
Загружено: 2020-08-29
Просмотров: 4956
https://mql5tutorial.com
With MQL5 for Metatrader5 we create an Expert Advisor that is able to automatically trade positions with a user defined take profit value that can be changed in the Expert Advisor settings without recompilation...
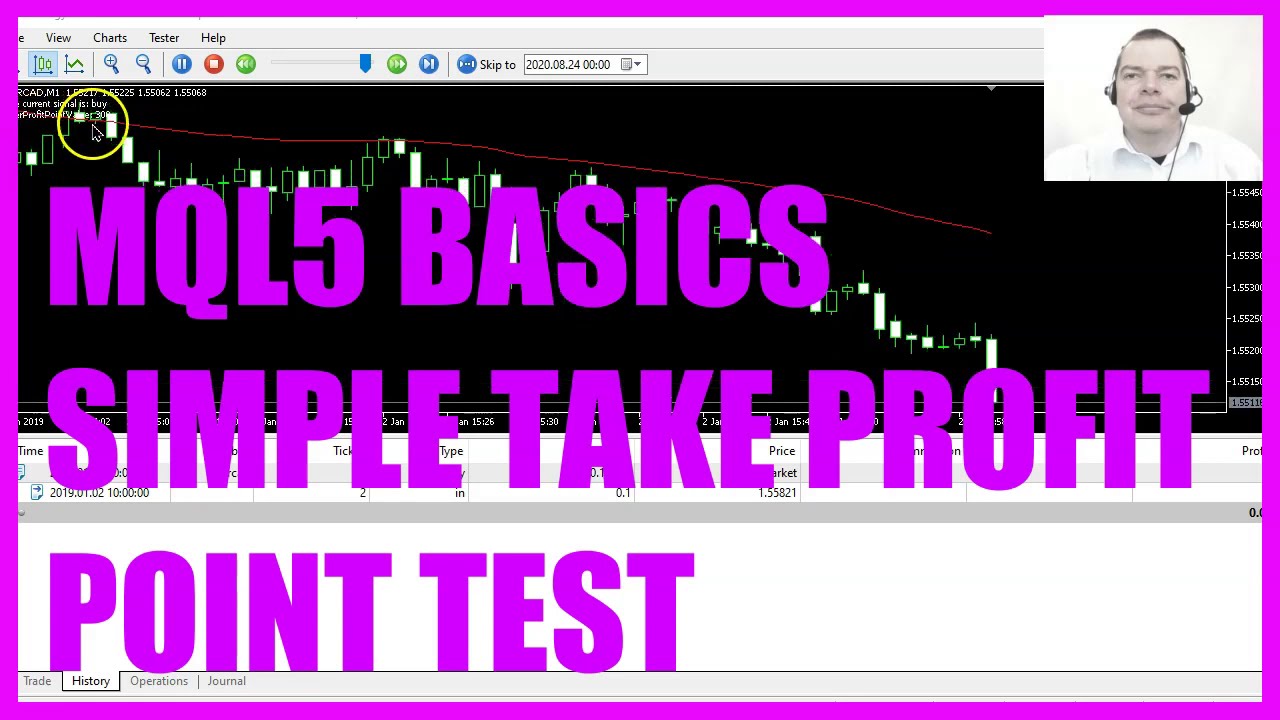
In this video, we want to test how to find the optimal value for the take profit points, so let’s find out how to do that with mql5.
To get started please click on a little icon here or press F4 on your keyboard, now you should see the Metaeditor window and here you want to click on file, new file, expert advisor from template, continue, I will call this file, simple profit point test, click on continue, continue and finish.
Now you can delete everything above the ontick function and the two comment lines here.
First, we want to include the file trade dot mqh, it contains the class ctrade and we are going to create an instance called trade. I also would like to create a user-defined variable for the profit value.
Inside of the ontick function, we start by calculating the ask price and the bid price that is done by using symbol info double for the currently selected symbol on the chart, we use either symbol ask or symbol underscore bid and with normalize double and underscore digits we automatically calculate the right number of digits behind the dot.
Now let’s use mql rates to get some price information because mql rates stores the information about prices, volumes and spread. Afterwards, we use array set as series for our price info array to sort the array from the current candle downwards and with copy rates we are going to fill our array for the current symbol on the chart and the currently selected period but I would like to use it with an underscore, basically, it’s the same. This one and this one are exchangeable and with copy rates, we can fill our price info array for the current symbol on the chart and the currently selected period on that chart. We start with candle zero and we copy the values for three candles and store them in the price info array.
Let’s create another array, called sma fifty array because we are going to use a simple moving average. Here comes the definition. I would like to use the integrated ima function for the current symbol on the chart and the currently selected period on that chart. I would like to calculate the value for fifty candles, don’t use a shift value here, this parameter is called mode underscore sma that stands for simple moving average and I would like to have the values calculated based on the close price.
Now let’s use array set as series to sort this one from the current candle downwards and now we can use copy buffer according to the sma fifty definition that we have created here to copy values for buffer zero, from the current candle zero for ten candles and store the values in the sma fifty array.
And to get the current sma value we just need to have a look into candle zero of our sma fifty array and now that we have the current value for the simple moving average we check if the simple moving average value is above the ask price, in that case, we want to buy, so we assign the word buy to our signal.
Otherwise, if the current sma value is below the bid price that’s when we want to sell and then we assign the word sell to our signal and if we have a sell signal and positions total is below one that would mean we don’t have any open positions but we want to sell, so now we use trade dot sell to sell ten micro lot.
And here is our user profit point value that we have defined, the basic value is three hundred but as it is an input value you can change that later on while the expert advisor running without any new compilation process.
Now let’s repeat that for the buy signal. If the signal equals buy and we have no open positions we use trade dot buy and but ten micro lot and this time we take the current ask price and add the user profit point value multiplied by the point value and that value depends on the current symbol you have on the chart.
Finally, we want to use the comment statement to output the current signal on the chart followed by the user profit point value that we are going to test and that’s about it.
Well, if this was too fast for you or if you have no idea what all the code here does maybe you want to watch one of the other videos in this basic video series or maybe even the premium course on our website might be interesting for you.
This once again was a question that was asked by a premium course member and if you are already a premium course member and have a question like this one please let me know, for now, let’s enable the toolbar and now you can click on the compile button or press F7, I made a mistake, I’m using a variable here that wasn’t declared, so let’s fix that, it is going to be a string variable called signal and we don’t assign a value here.
Доступные форматы для скачивания:
Скачать видео mp4
-
Информация по загрузке:


![[2026] Feeling Good Mix - English Deep House, Vocal House, Nu Disco | Emotional / Intimate Mood](https://image.4k-video.ru/id-video/cxLdtvzf2sI)