How to draw nested categorical boxplots in R using ggplot2? | Salaries | StatswithR | Arnab Hazra
Автор: StatswithR
Загружено: 2020-12-31
Просмотров: 10030
Here we explain how to generate a presentation/publication-quality nested categorical boxplots in R/R-studio using ggplot2. The codes for the steps explained in the video are as follows. Copy and paste them into R, run them one-by-one and try to understand what each argument is doing.
#datascience #datavisualization #visualization #ggplot2 #tidyverse #nestedboxplot #categoricalboxplot #boxplot #nested #categorical #Salaries #Salariesdataset #rstudio #rcoding
library(carData)
data("Salaries", package = "carData")
library(writexl)
write_xlsx(Salaries[ , c(1, 2, 6)], path = "Salaries.xlsx")
library(readxl)
data = read_excel("Salaries.xlsx")
head(data)
str(data)
library(ggplot2)
p = ggplot(data = data, aes(x=rank, y=salary / 1e3, fill=discipline)) + geom_boxplot()
ggsave(p, filename = "ggplot_nestbox1.pdf", height = 8, width = 8)
ranks = c("AsstProf", "AssocProf", "Prof")
data$rank = factor(data$rank, levels = ranks)
data$discipline = factor(data$discipline, levels = c("A", "B"))
data$salary = data$salary / 1e3
str(data)
p = ggplot(data = data, aes(x=rank, y=salary, fill=discipline)) + geom_boxplot()
ggsave(p, filename = "ggplot_nestbox2.pdf", height = 8, width = 8)
levels(data$rank) = c("Assistant Prof.", "Associate Prof.", "Full Prof.")
levels(data$discipline) = c("Theoretical", "Applied")
p = ggplot(data = data, aes(x=rank, y=salary, fill=discipline)) + geom_boxplot()
ggsave(p, filename = "ggplot_nestbox3.pdf", height = 8, width = 8)
p = ggplot(data = data, aes(x=rank, y=salary, fill=discipline)) +
stat_boxplot(geom = "errorbar") + geom_boxplot()
ggsave(p, filename = "ggplot_nestbox4.pdf", height = 8, width = 8)
p = ggplot(data = data, aes(x=rank, y=salary, fill=discipline)) +
stat_boxplot(geom = "errorbar") + geom_boxplot() +
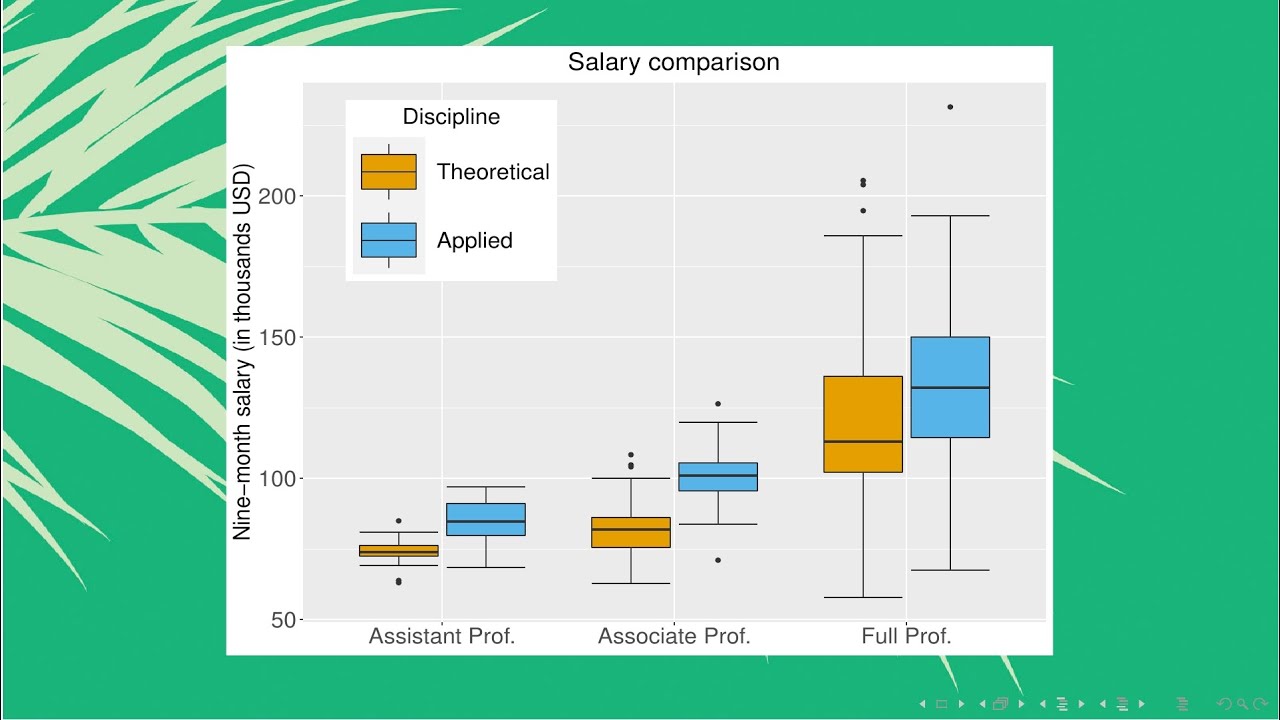
ggtitle("Salary comparison") + xlab(NULL) + ylab("Nine-month salary (in thousands USD)")
ggsave(p, filename = "ggplot_nestbox5.pdf", height = 8, width = 8)
p0 = ggplot(data = data, aes(x=rank, y=salary, fill=discipline)) +
stat_boxplot(geom = "errorbar") + geom_boxplot() +
ggtitle("Salary comparison") + xlab(NULL) + ylab("Nine-month salary (in thousands USD)") +
theme(axis.text=element_text(size=18),
axis.title=element_text(size=18),
plot.title = element_text(size=20, hjust = 0.5))
ggsave(p0, filename = "ggplot_nestbox6.pdf", height = 8, width = 8)
p = p0 + theme(legend.text=element_text(size=18),
legend.title = element_text(size=18, hjust = 0.5),
legend.key.height = unit(2,"cm"),
legend.key.width = unit(2,"cm"),
legend.position = c(0.2, 0.8)) +
guides(fill=guide_legend(title="Discipline"))
ggsave(p, filename = "ggplot_nestbox7.pdf", height = 8, width = 8)
cols = rep(c("#E69F00", "#56B4E9"), length(levels(data$rank)))
p = p0 + theme(legend.text=element_text(size=18),
legend.title = element_text(size=18, hjust = 0.5),
legend.key.height = unit(2,"cm"),
legend.key.width = unit(2,"cm"),
legend.position = c(0.2, 0.8)) +
guides(fill=guide_legend(title="Discipline")) +
scale_fill_manual(values=cols)
ggsave(p, filename = "ggplot_nestbox8.pdf", height = 8, width = 8)
Доступные форматы для скачивания:
Скачать видео mp4
-
Информация по загрузке:


