Excel Module 8 SAM Project A At Your Doorstep ANALYZE DATA WITH CHARTS AND PIVOTTABLE
Автор: Tutorial Previews
Загружено: 2025-06-11
Просмотров: 0
Excel Module 8 SAM Project A At Your Doorstep ANALYZE DATA WITH CHARTS AND PIVOTTABLE #shellycashman
If you directly want to get the project from us then contact us on our Whatsapp. Link is given here,
Whatsapp Contact Link:
https://api.whatsapp.com/message/4B6NMKKBK...
Whatsapp Number:
+919116641093
+918005564456
Gmail Id:
[email protected]
We are providing help in all Online Courses, Computer Science, Business and Management, Business Math, Business and Finance, Business and Accounting, Human Resource Management, History, English.
PROJECT STEPS
1. Shelby Cooke is a financial analyst for At Your Doorstep, an online grocery delivery service in Cleveland, Ohio. She is using an Excel workbook to analyze the company's recent financial performance, and asks for your help in creating advanced types of charts and PivotTables to provide an overview of delivery services, customers, and stores.
Go to the Deliveries worksheet, which contains a table named Services in the range B3:G17 that contains data about grocery deliveries. Shelby asks you to create a chart comparing the total charges to the three service types to identify the median charge by service type. Insert a chart as follows:
a. Create a Box and Whisker chart based on the Service Type data (range C3:C17) and the Total Charge data (range G3:G17).
b. Resize and position the chart so that it covers the range B19:G33.
c. Use Total Charge by Service Type as the chart title.
d. Format the data series using the default gradient fill to make the data easier to interpret.
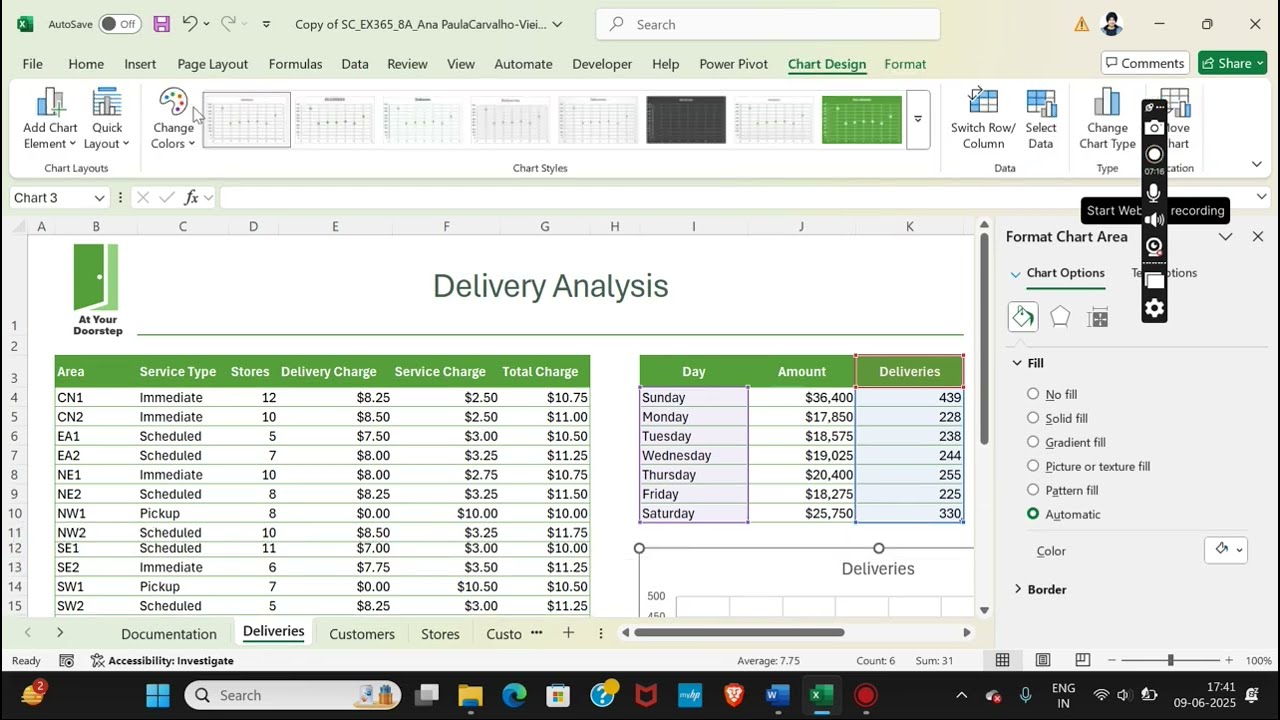
2. The Deliveries worksheet also contains a table named Deliveries in the range I3:K10 that compares the delivery data for each day of the week. Shelby asks you to create a chart that shows the relationship between the day and deliveries made.
a. Insert a Scatter chart that shows the relationship between the day of the week (range I3:I10) and the number of deliveries made (range K3:K10).
b. Resize and position the Scatter chart so that it covers the range I12:M33.
c. Use Deliveries and Days of the Week as the chart title.
3. Shelby wants to further analyze the relationship between deliveries and days of the week.
Add a Logarithmic trendline to the scatter chart.
4. Go to the Customers worksheet, which lists customer details in a table named Customers. Shelby wants to display the number of customers that have deliveries made to their homes or offices or to pick up in the store.
Insert a recommended PivotTable based on the Customers table as follows:
a. Insert the Count of Customer by Location recommended PivotTable. [Mac Hint: Use the Location field in the Rows area, the Customer field in the Values area, and show grand totals for columns only. Update the Value Field settings for the Customer field to Count.]
b. Use Delivery Locations as the name of the new worksheet.
c. Apply the Light Green, Pivot Style Medium 9 style to the PivotTable.
d. Add the Charge field to the Values area of the Field List, and then change its summary function to Average so that Shelby can determine the average charge for delivery locations.
e. Change the Number format of the Average of Charge value field to Currency with 2 decimal places and the $ symbol.
f. Use Total Customers as the column heading in cell B3, and use Average Charge as the column heading in cell C3.
5. Insert a PivotChart based on the new PivotTable as follows to help Shelby visualize the data:
a. Insert a Combo PivotChart based on the new PivotTable.
b. Display the Total Customers as a Clustered Column chart and the Average Charge as a Line chart.
c. Include a secondary axis for the Average Charge data.
d. Hide the Field List so that you have room to format the chart.
e. Change the minimum bounds for the value axis on the right to 6.
f. Change the PivotChart colors to Monochromatic Palette 1.
g. Resize and position the chart so that it covers the range D3:K17.
h. Display the Field List again.
6. Shelby also wants you to insert a PivotTable that includes other customer data so that she can analyze customer and scheduled delivery information. Return to the Customers worksheet, and then create a PivotTable based on the Customers table as follows:
a. Place the PivotTable on a new worksheet, and then use Customers Pivot as the name of the worksheet.
b. Display the Location field as column headings.
c. Display the Area field and then the Customer field as row headings.
d. Display the Years field as the values.
e. Display the Service Type field as a filter, and then filter the PivotTable to display customer information for Scheduled deliveries only.
f. Hide the field headers to reduce clutter in the PivotTable.
Доступные форматы для скачивания:
Скачать видео mp4
-
Информация по загрузке:


