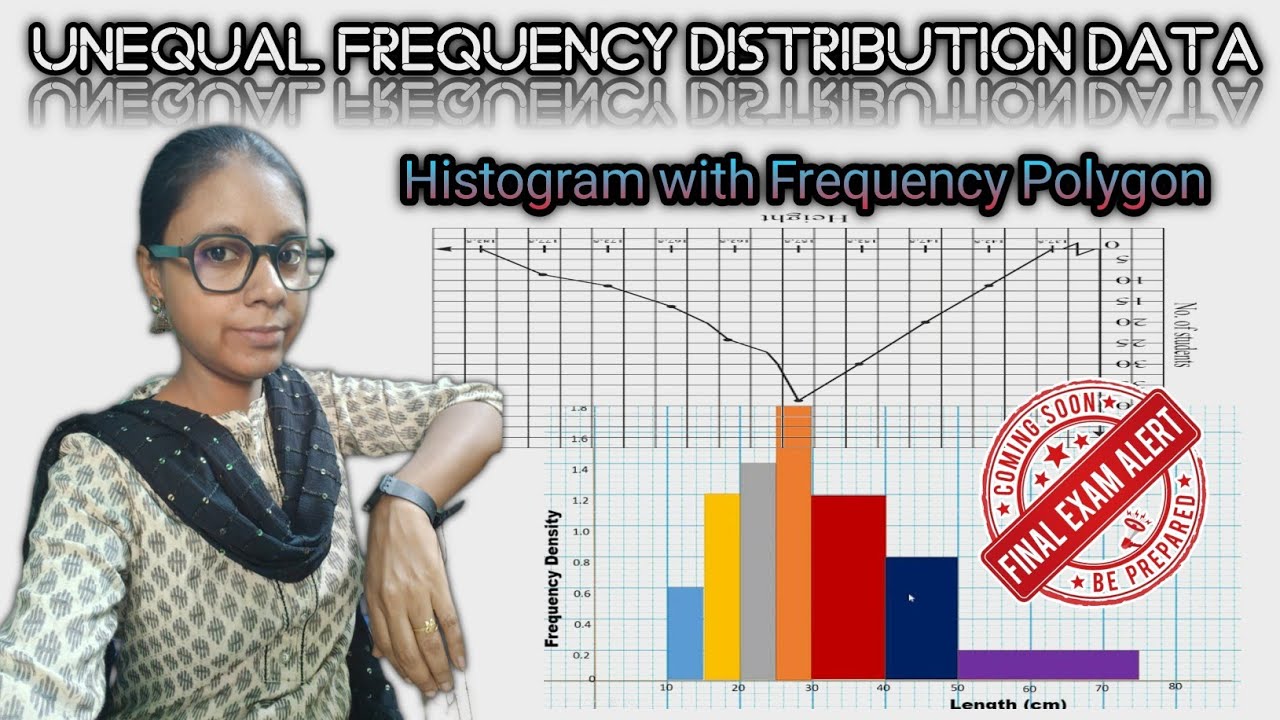
Histogram with Frequency Polygon in Statistical data
Автор: Daisy's Passion
Загружено: 2025-09-02
Просмотров: 34
Mathematical Calculation and drawing of Histogram with Frequency Polygon in Statistical data Class 12 board examination conducted by the West Bengal Council of Higher Secondary Education (WBCHSE)
New Section Semester System exam held.
Queries:
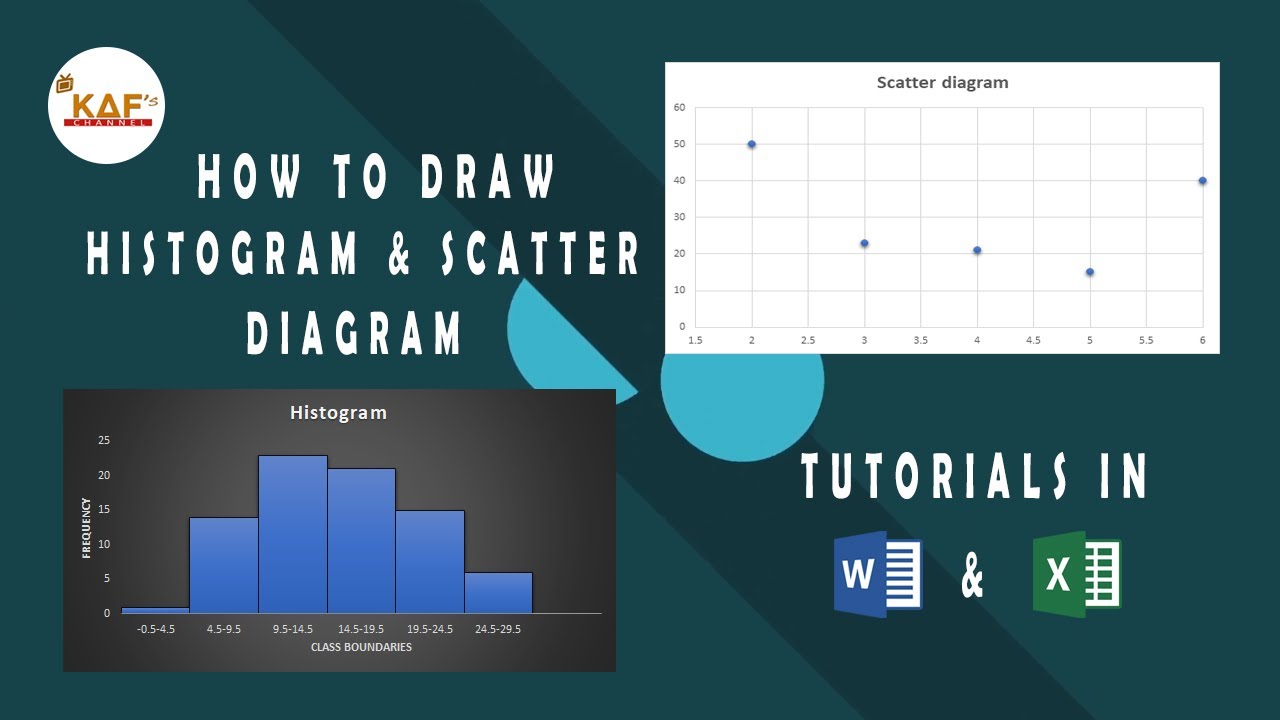
How to draw and calculate Histogram
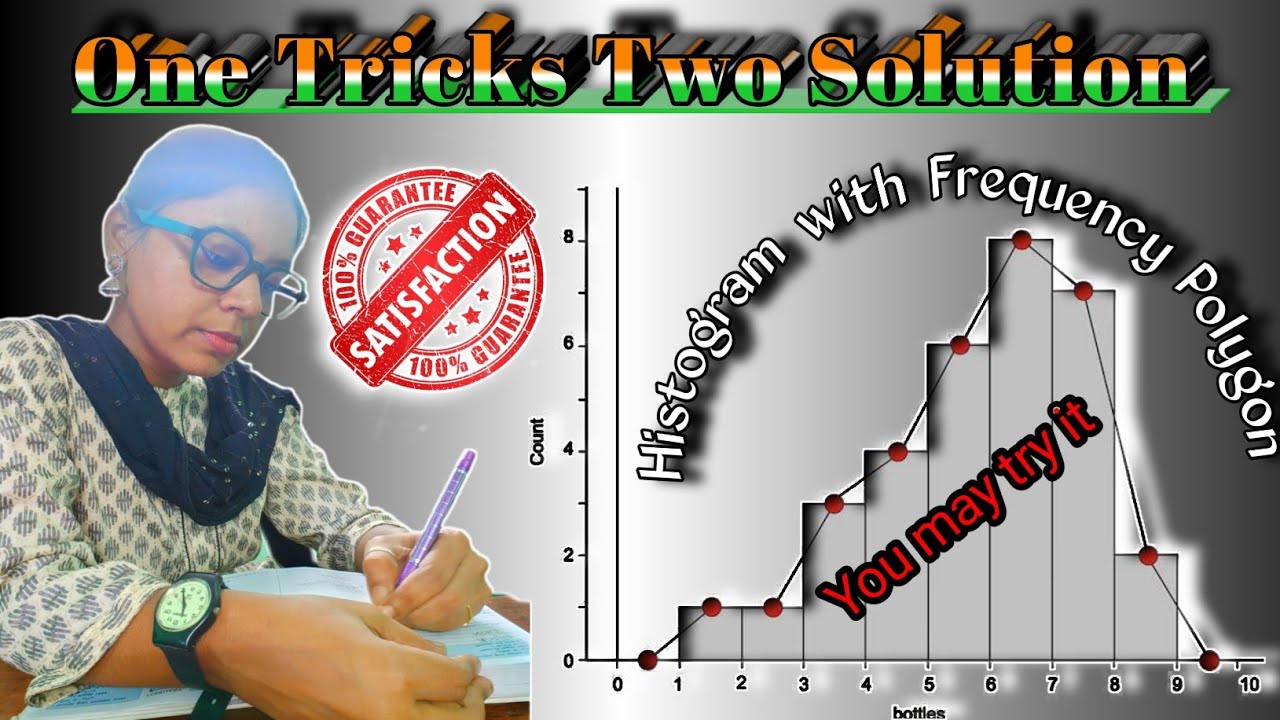
How to make frequency Polygon
Histogram Calculations and drawing
Tricks and Ideas 💡 to solved Statistical data
Related video link
• Histogram Class -XII Geography Semester Sy...
• Histogram Class XII Semester System WBCHSE...
• Geography Prectical Syllabus Class XII Sem...
• Cummulative Frequency distribution with M...
• Cummulative Frequency Curve More then and ...
• How to calculate and draw Median in Statis...
#hs_semestersystem_geography_practical_question_answer
#frequencypolygon_drawing
#class_12_geography_practical_frequencypolygon_drawing
#geography_practical
#geography_tutorial
#frequency_polygon
#statistics_analysis
#how-to-calculate-histogram
#data_analysis
#class_XII_practical
#histogram
#histograms
#frequency
#frequencypolygon
#practicalgeography
#frequency_polygon
#histogram_with_Frequencypolygon
Доступные форматы для скачивания:
Скачать видео mp4
-
Информация по загрузке: