Популярное

Музыка Кино и Анимация Автомобили Животные Спорт Путешествия Игры Юмор

Интересные видео

2025 Сериалы Трейлеры Новости Как сделать Видеоуроки Diy своими руками

Топ запросов

смотреть а4 schoolboy runaway турецкий сериал смотреть мультфильмы эдисон
dTub
Скачать

PowerPoint Infographics: Doughnut Charts (Advanced Data-Driven)

Автор: Presentation Process

Загружено: 2018-01-26

Просмотров: 31976

Описание:

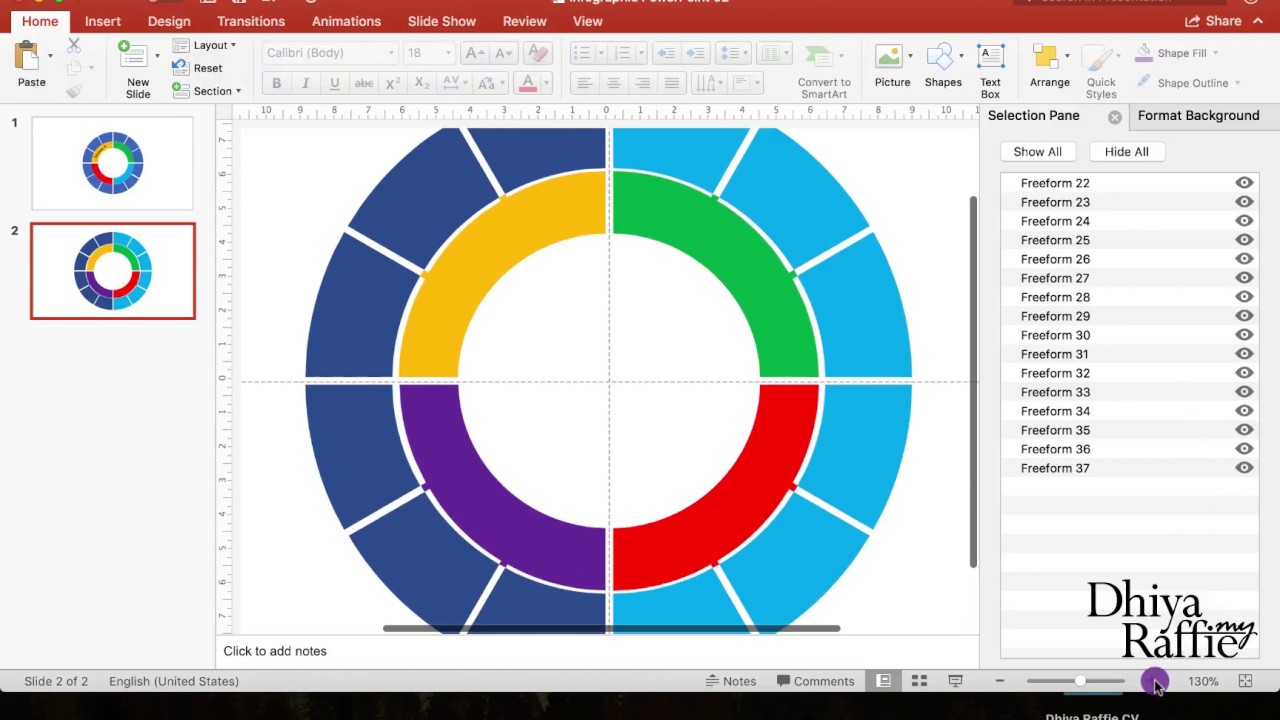
In this video, you will find how to create stylish PowerPoint Infographic with data-driven Doughnut Chart.

You can use this Doughnut chart make your report presentations more interesting and engaging. We use the data-driven charts feature already available in PowerPoint. You can create this same chart in Excel as well.

Such creative infographics help your audience visualize the data better.

This report presentation video is in response to the PowerPoint Question and Answer session held by Ramgopal live on YouTube on Jan 25th, 2018.

Sign Up For Newsletter
=================
https://www.presentation-process.com/...

Comprehensive All In One Bundle - PowerPoint Templates:
================================
https://shop.presentation-process.com...
Ramgopal's PowerPoint Mastery Training Program:
================================
https://www.presentation-process.com/...

PowerPoint Infographics: Doughnut Charts  (Advanced Data-Driven)

Поделиться в:

Доступные форматы для скачивания:

Скачать видео mp4

  • Информация по загрузке:

Скачать аудио mp3

Похожие видео

PowerPoint Morph : Text Animation Trick

PowerPoint Morph : Text Animation Trick

Make Impressive McKinsey Visuals in Excel!

Make Impressive McKinsey Visuals in Excel!

PPT Visualization: Data Driven 3D Battery Chart in Power Point Presentation

PPT Visualization: Data Driven 3D Battery Chart in Power Point Presentation

Инфографика круговой диаграммы прогресса на панели мониторинга Excel

Инфографика круговой диаграммы прогресса на панели мониторинга Excel

82.PowerPoint Tutorial 5 Step Circular infographic Presentation | Free Download

82.PowerPoint Tutorial 5 Step Circular infographic Presentation | Free Download

Фишки Excel, которые я использую КАЖДЫЙ ДЕНЬ! ЭТО нужно каждому

Фишки Excel, которые я использую КАЖДЫЙ ДЕНЬ! ЭТО нужно каждому

💎 Create PowerPoint Infographics

💎 Create PowerPoint Infographics

Presenting Financials with PowerPoint

Presenting Financials with PowerPoint

Use PowerPoint Slide ZOOM the Right Way Creating Prezi-Like Presentations

Use PowerPoint Slide ZOOM the Right Way Creating Prezi-Like Presentations

Animated PowerPoint Infographic Tutorial (Challenge!)

Animated PowerPoint Infographic Tutorial (Challenge!)

System Design Concepts Course and Interview Prep

System Design Concepts Course and Interview Prep

Учебное пособие по MS PowerPoint: Многоуровневая диаграмма «колесо/пончик» (Обучающий центр в Мал...

Учебное пособие по MS PowerPoint: Многоуровневая диаграмма «колесо/пончик» (Обучающий центр в Мал...

How to Create a Infographic in Excel (pictogram with icons)

How to Create a Infographic in Excel (pictogram with icons)

Excel Chart Animation in PowerPoint 🔥Speedometer🔥

Excel Chart Animation in PowerPoint 🔥Speedometer🔥

How to Create Clock Needle Animation Effect in PowerPoint

How to Create Clock Needle Animation Effect in PowerPoint

3D Graph on a tablet in PowerPoint | Convert 2D chart to 3D chart

3D Graph on a tablet in PowerPoint | Convert 2D chart to 3D chart

Animated PowerPoint Slide Design Tutorial 🔥Doughnut Charts🔥

Animated PowerPoint Slide Design Tutorial 🔥Doughnut Charts🔥

Multilayered Doughnut Chart : Part-1

Multilayered Doughnut Chart : Part-1

Создание слайда с градиентной кольцевой диаграммой в PowerPoint | Урок 1013 | Бесплатный шаблон

Создание слайда с градиентной кольцевой диаграммой в PowerPoint | Урок 1013 | Бесплатный шаблон

DATA SLIDES in PowerPoint 😲 How to make them engaging.

DATA SLIDES in PowerPoint 😲 How to make them engaging.

© 2025 dtub. Все права защищены.


  • Контакты
  • О нас
  • Политика конфиденциальности


Контакты для правообладателей: infodtube@gmail.com