Statistics with R (1) - Linear regression
Автор: Christoph Scherber
Загружено: 2013-09-05
Просмотров: 439139
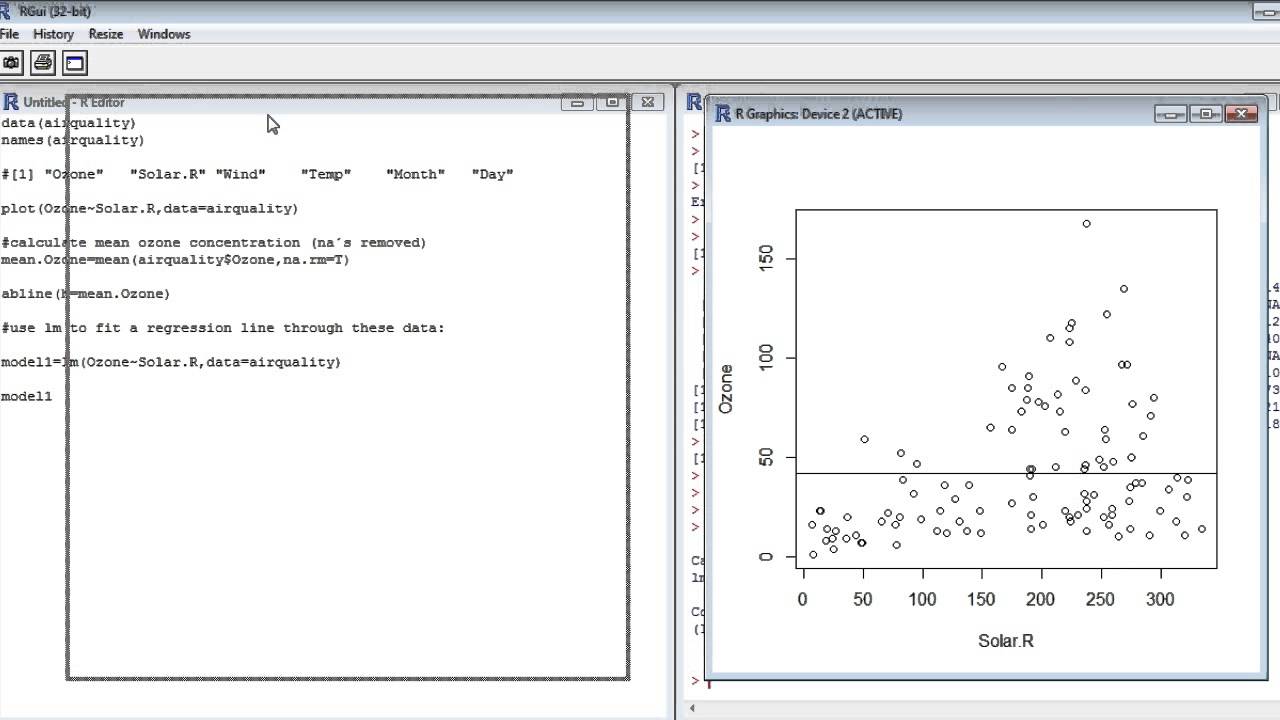
In this video, I show how to use R to fit a linear regression model using the lm() command. I also introduce how to plot the regression line and the overall arithmetic mean of the response variable, and I briefly explain the use of diagnostic plots to inspect the residuals. Basic features of the R interface (script window, console window) are introduced.
The R code used in this video is:
data(airquality)
names(airquality)
#[1] "Ozone" "Solar.R" "Wind" "Temp" "Month" "Day"
plot(Ozone~Solar.R,data=airquality)
#calculate mean ozone concentration (na´s removed)
mean.Ozone=mean(airquality$Ozone,na.rm=T)
abline(h=mean.Ozone)
#use lm to fit a regression line through these data:
model1=lm(Ozone~Solar.R,data=airquality)
model1
abline(model1,col="red")
plot(model1)
termplot(model1)
summary(model1)
Доступные форматы для скачивания:
Скачать видео mp4
-
Информация по загрузке:


![[2026] Feeling Good Mix - English Deep House, Vocal House, Nu Disco | Emotional / Intimate Mood](https://image.4k-video.ru/id-video/cxLdtvzf2sI)


