👉 Download the Project File here: https://bit.ly/40Ff7os
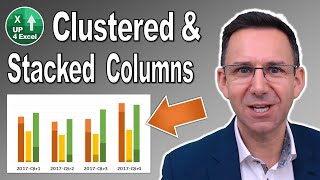
In this video tutorial you'll learn how to create a Clustered Stacked Column Chart in Excel. The steps are the same if you want to make a Stacked Bar Chart Excel.
🎓 Join 60,000+ professionals in our courses for ONLY $9.99 !!
👉 https://www.udemy.com/user/andrewex/
🎓 BEST-SELLING COURSES
📖 Excel Dashboard and Data Analysis Masterclass ▶️ https://bit.ly/35lO8OK
📖 Excel Power Query, Power Pivot, Power BI, Power 3D Map & DAX ▶️ https://bit.ly/2qwa2jB
📖 Excel Financial Modeling and Business Analysis Masterclass ▶️ https://bit.ly/3RgKXTq
📖 Microsoft Power BI Desktop Masterclass ▶️ https://bit.ly/3RtTFwm
📖 Excel Macros & Excel VBA Programming for Beginners ▶️ https://bit.ly/2D3Ipkw
📖 Excel Charts, Infographics & Data Visualization Masterclass ▶️ https://bit.ly/2qyosQr
📖 Excel Tips & Shortcuts: 100+ Powerful Hacks for Beginners ▶️ https://bit.ly/2pEMlW8
📖 Python for Absolute Beginners: Learn Python in a Week! ▶️ https://bit.ly/2s1nUTy
📖 Gmail Complete Course: 25+ Google email Techniques ▶️ https://bit.ly/2QCaUxQ
▬▬▬▬▬▬▬▬▬▬▬▬▬▬▬▬▬▬▬▬▬▬▬▬▬▬▬▬▬▬▬▬▬▬▬▬▬
Join the FREE COURSE 💥 TOP 30 Excel Productivity Tips: https://bit.ly/3w8yclD
▬▬▬▬▬▬▬▬▬▬▬▬▬▬▬▬▬▬▬▬▬▬▬▬▬▬▬▬▬▬▬▬▬▬▬▬▬
⌚ Timestamps
00:00 Introduction
00:15 Prepare your Data
00:40 Create the Chart
01:00 Modify the Chart
🎓 Join 60,000+ professionals in our courses here 👉 https://courses.mellontraining.com
🎬 LINKS to other videos:
Make An INTERACTIVE MAP CHART In Excel 👉 • How to Create An Excel INTERACTIVE MAP CHA...
Make An Excel PANEL CHART 👉 • Create a PANEL CHART in Excel
Add Text to Numbers AUTOMATICALLY 👉 • How to Add Text to Numbers in Excel
Sum Excel Tables in ONE STEP 👉 • How to Sum Excel Tables in ONE STEP
Supercharge Your Spreadsheets with Excel's Goal Seek 👉 • How to use Goal Seek in Excel for What-If ...
Excel SUMPRODUCT Function 👉 • Why Excel SUMPRODUCT is About to Change Yo...
2 WAYS to create Excel Bar & Donut Charts 👉 • How to Create Advanced Excel Bar & Donut C...
Mastering Excel Pareto Charts 👉 • How to Make a Pareto Chart in Excel
📊 Excel Your Skills: www.mellontraining.com
🎁 SHARE this video and spread the Excel love.
Or if you’re short of time, please click the 👍
#excel #excelcharts
Поделиться в:
Доступные форматы для скачивания:
Скачать видео mp4
Информация по загрузке:
Скачать аудио mp3
Похожие видео
array(10) {
[0]=>
object(stdClass)#6350 (5) {
["video_id"]=>
int(9999999)
["related_video_id"]=>
string(11) "4roVtL2mynA"
["related_video_title"]=>
string(166) "Сводные таблицы Excel с нуля до профи за полчаса + Дэшборды! | 1-ое Видео курса "Сводные Таблицы""
["posted_time"]=>
string(21) "4 года назад"
["channelName"]=>
string(47) "Билял Хасенов – Excel, VBA & More"
}
[1]=>
object(stdClass)#6323 (5) {
["video_id"]=>
int(9999999)
["related_video_id"]=>
string(11) "9Nye5NO172A"
["related_video_title"]=>
string(70) "Combination Stacked & Clustered Column Chart in Excel - 2 Examples"
["posted_time"]=>
string(21) "3 года назад"
["channelName"]=>
string(15) "Chester Tugwell"
}
[2]=>
object(stdClass)#6348 (5) {
["video_id"]=>
int(9999999)
["related_video_id"]=>
string(11) "0zjbF9rTHA4"
["related_video_title"]=>
string(55) "How To Create A Clustered Stacked Column Chart In Excel"
["posted_time"]=>
string(19) "5 лет назад"
["channelName"]=>
string(8) "Up4Excel"
}
[3]=>
object(stdClass)#6355 (5) {
["video_id"]=>
int(9999999)
["related_video_id"]=>
string(11) "a3-nkc_VUF0"
["related_video_title"]=>
string(123) "Эти ОШИБКИ совершает КАЖДЫЙ новичок в Excel. Избавься от них НАВСЕГДА!"
["posted_time"]=>
string(25) "2 недели назад"
["channelName"]=>
string(54) "Эксперт ЭКСЕЛЬ и ГУГЛ-ТАБЛИЦЫ"
}
[4]=>
object(stdClass)#6334 (5) {
["video_id"]=>
int(9999999)
["related_video_id"]=>
string(11) "y0-l54dm-uc"
["related_video_title"]=>
string(109) "Функция ВПР в Excel ➤ Как пользоваться функцией ВПР (VLOOKUP) в Excel"
["posted_time"]=>
string(21) "4 года назад"
["channelName"]=>
string(23) "Андрей Сухов"
}
[5]=>
object(stdClass)#6352 (5) {
["video_id"]=>
int(9999999)
["related_video_id"]=>
string(11) "ESMKHIvFbl8"
["related_video_title"]=>
string(69) "How to Create a Fully Automated Data Entry Form in Excel (in 4 STEPS)"
["posted_time"]=>
string(25) "2 месяца назад"
["channelName"]=>
string(19) "Andreas Exadaktylos"
}
[6]=>
object(stdClass)#6347 (5) {
["video_id"]=>
int(9999999)
["related_video_id"]=>
string(11) "aQRj2Z-Eb1Y"
["related_video_title"]=>
string(129) "⚡️ Самая масштабная атака РФ по Украине || Путина просят о помиловании"
["posted_time"]=>
string(24) "12 часов назад"
["channelName"]=>
string(23) "Время Прядко"
}
[7]=>
object(stdClass)#6357 (5) {
["video_id"]=>
int(9999999)
["related_video_id"]=>
string(11) "IwWh3UOTymE"
["related_video_title"]=>
string(60) "Excel Column Chart - Stacked and Clustered combination graph"
["posted_time"]=>
string(19) "7 лет назад"
["channelName"]=>
string(13) "Leila Gharani"
}
[8]=>
object(stdClass)#6333 (5) {
["video_id"]=>
int(9999999)
["related_video_id"]=>
string(11) "h3RFPALHcOc"
["related_video_title"]=>
string(115) "8 инструментов в Excel, которыми каждый должен уметь пользоваться"
["posted_time"]=>
string(21) "3 года назад"
["channelName"]=>
string(47) "Билял Хасенов – Excel, VBA & More"
}
[9]=>
object(stdClass)#6351 (5) {
["video_id"]=>
int(9999999)
["related_video_id"]=>
string(11) "xGLQD-8WzQA"
["related_video_title"]=>
string(46) "How to Make a Mekko (Marimekko) Chart in Excel"
["posted_time"]=>
string(27) "5 месяцев назад"
["channelName"]=>
string(19) "Andreas Exadaktylos"
}
}