Популярное

Музыка Кино и Анимация Автомобили Животные Спорт Путешествия Игры Юмор

Интересные видео

2025 Сериалы Трейлеры Новости Как сделать Видеоуроки Diy своими руками

Топ запросов

смотреть а4 schoolboy runaway турецкий сериал смотреть мультфильмы эдисон
dTub
Скачать

Measuring Multiple Facets of Python Performance With Scalene | Real Python Podcast

Автор: Real Python

Загружено: 2023-09-15

Просмотров: 1045

Описание:

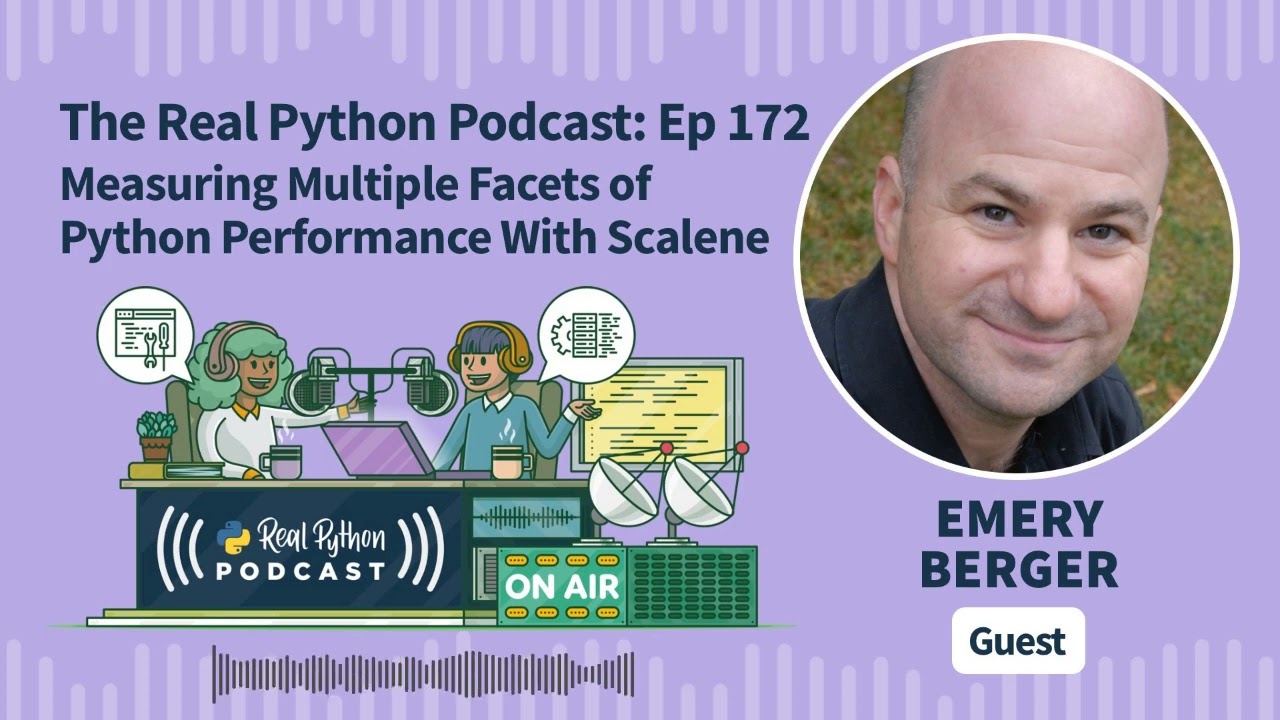
When choosing a tool for profiling Python code performance, should it focus on the CPU, GPU, memory, or individual lines of code? What if it looked at all those factors and didn't alter code performance while measuring it? This week on the show, we talk about Scalene with Emery Berger, Professor of Computer Science at the University of Massachusetts Amherst.

👉 Links from the show: https://realpython.com/podcasts/rpp/172/

Emery talks about his background in memory management and his collaboration on Hoard, a scalable memory manager system used in Mac OS X. We discuss the need for improving code performance on modern computer architecture. He highlights this idea by contrasting the familiar limitations of Moore's law with the lesser-known rule of Dennard scaling.

Working with his students in the university lab, they developed Scalene. Scalene is a high-performance CPU, GPU, and memory profiler. It can look at code from the individual function or line-by-line level and compare time spent in Python vs. C code. Emery talks about the recent Scalene feature of AI-powered optimization proposals and covers a couple examples. He also shares a collection of additional Python code-assistant tools from their lab.

Topics:

00:00:00 -- Introduction
00:02:13 -- College of information and Computer Sciences
00:03:25 -- Memory management systems background
00:05:15 -- Dennard Scaling vs Moore's Law
00:10:12 -- Starting work on Python profiling
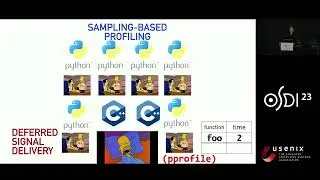
00:15:00 -- Deciding on a statistical profiler
00:17:05 -- Wanting to trace memory
00:21:21 -- Finding memory issues
00:23:59 -- Line-by-line analysis
00:25:56 -- Video Course Spotlight
00:27:14 -- Measuring profiler performance
00:30:30 -- Memory leak detection
00:34:31 -- When should you run a profiler?
00:37:27 -- Considerations for measuring cloud performance
00:39:12 -- Working with Jupyter and Conda
00:42:18 -- Common issues and AI solutions
00:45:50 -- Using a profiler to learn a code base
00:50:48 -- Examples of AI-powered optimizations
00:55:50 -- What are you excited about in the world of Python?
00:58:30 -- What do you want to learn next?
01:01:48 -- How can people follow your work online?
01:02:56 -- Thanks and goodbye

👉 Links from the show: https://realpython.com/podcasts/rpp/172/

Measuring Multiple Facets of Python Performance With Scalene | Real Python Podcast

Поделиться в:

Доступные форматы для скачивания:

Скачать видео mp4

  • Информация по загрузке:

Скачать аудио mp3

Похожие видео

Getting Involved in Open Source & Generating QR Codes With Python | Real Python Podcast #173

Getting Involved in Open Source & Generating QR Codes With Python | Real Python Podcast #173

"Python Performance Matters" by Emery Berger (Strange Loop 2022)

Scalene: a high-performance, high-precision CPU+GPU+memory profiler for Python (PyCon US 2021)

Scalene: a high-performance, high-precision CPU+GPU+memory profiler for Python (PyCon US 2021)

Memray: The endgame Python memory profiler - Talk Python to Me Ep.425

Memray: The endgame Python memory profiler - Talk Python to Me Ep.425

Python GUI Builder - PyUiBuilder

Python GUI Builder - PyUiBuilder

Optimize Your Python Programs: Code Profiling with cProfile

Optimize Your Python Programs: Code Profiling with cProfile

PyCon US 2021

PyCon US 2021

Декораторы Python — наглядное объяснение

Декораторы Python — наглядное объяснение

Трамп опять презирает Зеленского?

Трамп опять презирает Зеленского?

КАК УСТРОЕН TCP/IP?

КАК УСТРОЕН TCP/IP?

Вся IT-база в ОДНОМ видео: Память, Процессор, Код

Вся IT-база в ОДНОМ видео: Память, Процессор, Код

OSDI '23 - Triangulating Python Performance Issues with SCALENE

OSDI '23 - Triangulating Python Performance Issues with SCALENE

Где начало СХЕМЫ? Понимаем, читаем, изучаем схемы. Понятное объяснение!

Где начало СХЕМЫ? Понимаем, читаем, изучаем схемы. Понятное объяснение!

Самый быстрый способ создания цикла в Python — горькая правда

Самый быстрый способ создания цикла в Python — горькая правда

Ralph Loop — x100 продуктивности Claude Code

Ralph Loop — x100 продуктивности Claude Code

ФИЗИКИ не знают что такое ЭЛЕКТРИЧЕСКИЙ ТОК 💤Лекция для сна 💤 СОН ЗА 5 МИНУТ

ФИЗИКИ не знают что такое ЭЛЕКТРИЧЕСКИЙ ТОК 💤Лекция для сна 💤 СОН ЗА 5 МИНУТ

TALK / Emery Berger / Scalene: A high-performance, high-precision CPU+GPU+memory profiler for Python

TALK / Emery Berger / Scalene: A high-performance, high-precision CPU+GPU+memory profiler for Python

Modern Approaches to Profiling in Python with Scalene

Modern Approaches to Profiling in Python with Scalene

Что такое Rest API (http)? Soap? GraphQL? Websockets? RPC (gRPC, tRPC). Клиент - сервер. Вся теория

Что такое Rest API (http)? Soap? GraphQL? Websockets? RPC (gRPC, tRPC). Клиент - сервер. Вся теория

Zettelkasten + AI: Как я связал ChatGPT и Obsidian в единую систему знаний

Zettelkasten + AI: Как я связал ChatGPT и Obsidian в единую систему знаний

© 2025 dtub. Все права защищены.


  • Контакты
  • О нас
  • Политика конфиденциальности


Контакты для правообладателей: infodtube@gmail.com