Популярное

Музыка Кино и Анимация Автомобили Животные Спорт Путешествия Игры Юмор

Интересные видео

2025 Сериалы Трейлеры Новости Как сделать Видеоуроки Diy своими руками

Топ запросов

смотреть а4 schoolboy runaway турецкий сериал смотреть мультфильмы эдисон
dTub
Скачать

Power BI Anomaly Detection + Smart Narratives + Q&A + Analyze : AI Artificial Intelligence Part 3

Автор: Lighthouse Analytix

Загружено: 2022-12-05

Просмотров: 2083

Описание:

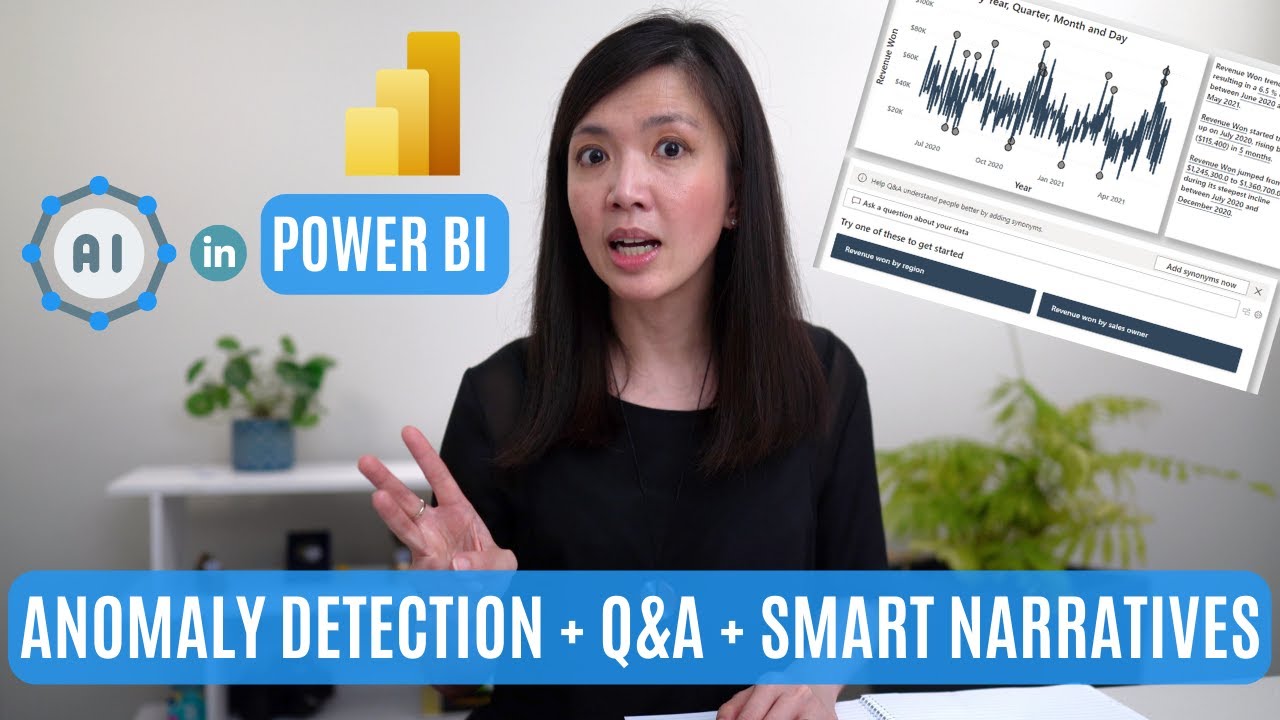
Amazing combo Anomaly Detection + Drill Up & Down + use of ANALYZE built in feature in line chart. Combined that with Smart Narratives and Q&A Visuals, and a 4 in 1 bar charts, you will have a super amazing page, just like in Page 3 of our sample Artificial Intelligence report.

This video is a continuation of Artificial Intelligence series which I have posted in previous weeks, created to show case how to rebuild a Power BI report with Artificial Intelligence features which I came across from Microsoft PBI learning portal, from scratch.

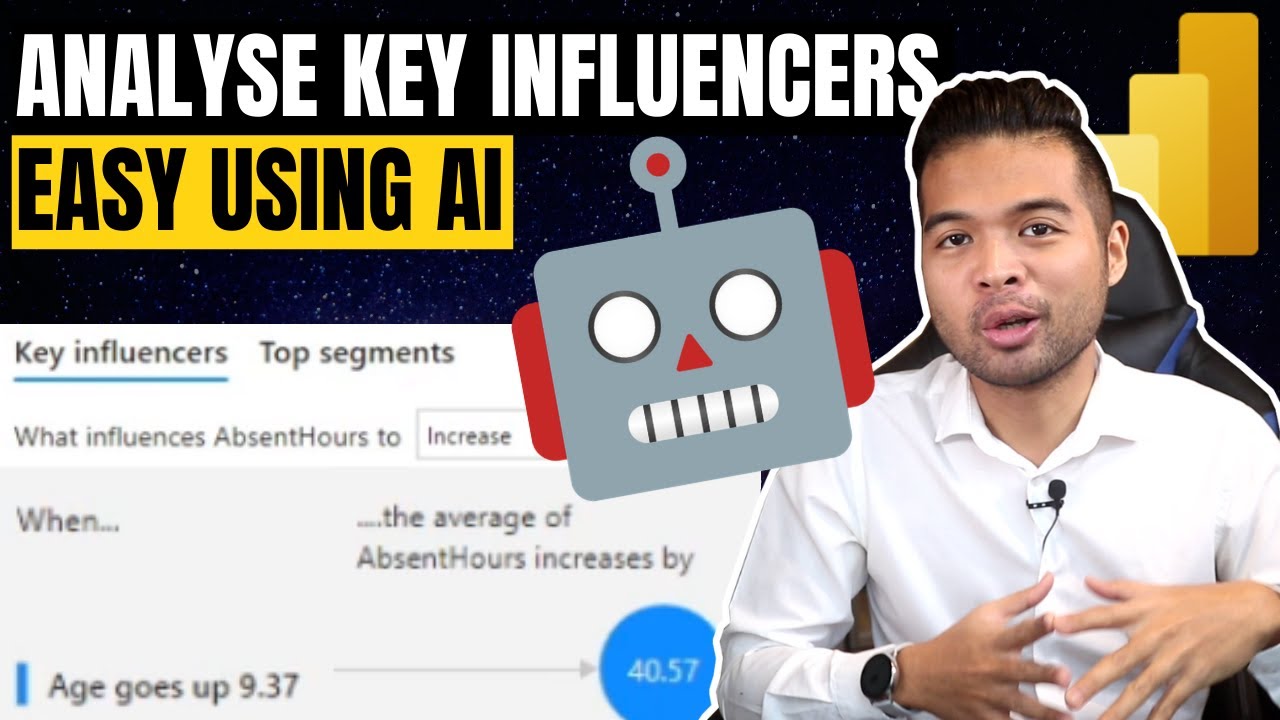
If you haven't watched my previous videos, where I went through Artificial Intelligence features in Power BI - Page 1 - Key Influencer Visuals. here is the link:
   • Power BI Report with Key Influencer : AI A...  

And this is the link of the video, where I went through Artificial Intelligence features in Power BI - Page 1 - Key Influencer Visuals to Page 2 - Decomposition Tree:
   • Power BI Report with Decomposition Tree : ...  

This video consist of two parts.

In part 1, I will focus on exploring each elements found in Page 3 - Anomaly Detection, which I found to be super impressive
Exploring the capabilities of Q&A visuals
Exploring what you can do with a Line Chart || Drill up & down, ANALYZE, and utilising the Anomaly Detection capabilities.
Exploring Smart Narrative box

In part 2, I will show you how you we can create the entire page 3 from scratch, i.e. how to create:
Q&A visual
Smart Narratives
Line Chart with Anomaly Detection
4 in 1 Bar Charts
slicer in the bonus video section.

I sincerely hope that you will enjoy this Artificial Intelligence videos and will gain more familiarity, comfort and confidence in leveraging various Artificial Intelligence capabilities in your future Power BI report.

Kind regards,
Isabella Susilowati @LighthouseAnalytix , #Powerbi, #powerbitutorial, #powerbiforbeginners

Timelines:
00:00 Intro
02:02 Q&A Visual
02:47 Line Chart Drill Up/Down
03:16 "Analyze" Line Chart To Explain Increase/Decrease
05:24 Line Chart Anomaly Detection
06:26 Smart Narratives
08:12 4 in 1 Bar Chart
08:36 Recreate AI Page 3
15:53 Epilogue
16:36 Bonus How To Create Slicer

LA71
The PBIX file that I used in this video can be downloaded for FREE via my website: https://lighthouseanalytix.com/tutori...
Look for AI in Power BI.

Power BI Anomaly Detection + Smart Narratives + Q&A + Analyze : AI Artificial Intelligence Part 3

Поделиться в:

Доступные форматы для скачивания:

Скачать видео mp4

  • Информация по загрузке:

Скачать аудио mp3

Похожие видео

Power BI Report with Key Influencer : AI Artificial Intelligence Part 1 + FREE PBIX DOWNLOAD

Power BI Report with Key Influencer : AI Artificial Intelligence Part 1 + FREE PBIX DOWNLOAD

Используйте ИИ для автоматизации ключевых факторов влияния в данных Power BI // Руководство для н...

Используйте ИИ для автоматизации ключевых факторов влияния в данных Power BI // Руководство для н...

Power BI Report Data Model to Easily Compare Across Two Periods with Simple Waterfall Chart & Tables

Power BI Report Data Model to Easily Compare Across Two Periods with Simple Waterfall Chart & Tables

Удобные отчеты Power BI со встроенной справкой!

Удобные отчеты Power BI со встроенной справкой!

Как подготовить данные для использования ИИ в Power BI!

Как подготовить данные для использования ИИ в Power BI!

Exploring ANOMALY detection in Power BI and a SNEAK PEAK

Exploring ANOMALY detection in Power BI and a SNEAK PEAK

Power BI AI & ML - Artificial Intelligence & Machine Learning

Power BI AI & ML - Artificial Intelligence & Machine Learning

Anomaly Detection in Power BI

Anomaly Detection in Power BI

Power BI против дашбордов Excel — и кто же победил?..

Power BI против дашбордов Excel — и кто же победил?..

ВИЗУАЛЬНЫЙ МАТЕРИАЛ, который должен знать каждый аналитик | ГИСТОГРАММА с динамическими ячейками ...

ВИЗУАЛЬНЫЙ МАТЕРИАЛ, который должен знать каждый аналитик | ГИСТОГРАММА с динамическими ячейками ...

Use Smart Narrative to get insights from Power BI Report

Use Smart Narrative to get insights from Power BI Report

Copilot для Power BI: ваше полное руководство по Copilot

Copilot для Power BI: ваше полное руководство по Copilot

Top 5 Awesome Power BI Visuals You Probably Didn't Know

Top 5 Awesome Power BI Visuals You Probably Didn't Know

How To Create these useful Power Bi Visuals that Excel Lacks

How To Create these useful Power Bi Visuals that Excel Lacks

В чём разница между 5 визуализациями карт Power BI? Полное руководство для начинающих

В чём разница между 5 визуализациями карт Power BI? Полное руководство для начинающих

Создайте панель срезов в Power BI как профессионал

Создайте панель срезов в Power BI как профессионал

Smart Narratives and Conditional Formatting in Power BI? Yes please!

Smart Narratives and Conditional Formatting in Power BI? Yes please!

Для Чего РЕАЛЬНО Нужен был ГОРБ Boeing 747?

Для Чего РЕАЛЬНО Нужен был ГОРБ Boeing 747?

Перестаньте использовать длинные формулы: попробуйте вместо них «*» и «?»

Перестаньте использовать длинные формулы: попробуйте вместо них «*» и «?»

Anomaly Detection Analysis in Power BI (also for MS Excel) - connected to Azure API & MySQL Database

Anomaly Detection Analysis in Power BI (also for MS Excel) - connected to Azure API & MySQL Database

© 2025 dtub. Все права защищены.


  • Контакты
  • О нас
  • Политика конфиденциальности


Контакты для правообладателей: infodtube@gmail.com