DigSILENT PowerFactory P-V,Q-V curve plot
Автор: Random
Загружено: 2018-04-24
Просмотров: 16475
Welcome to this DigSILENT PowerFactory Tutorial!
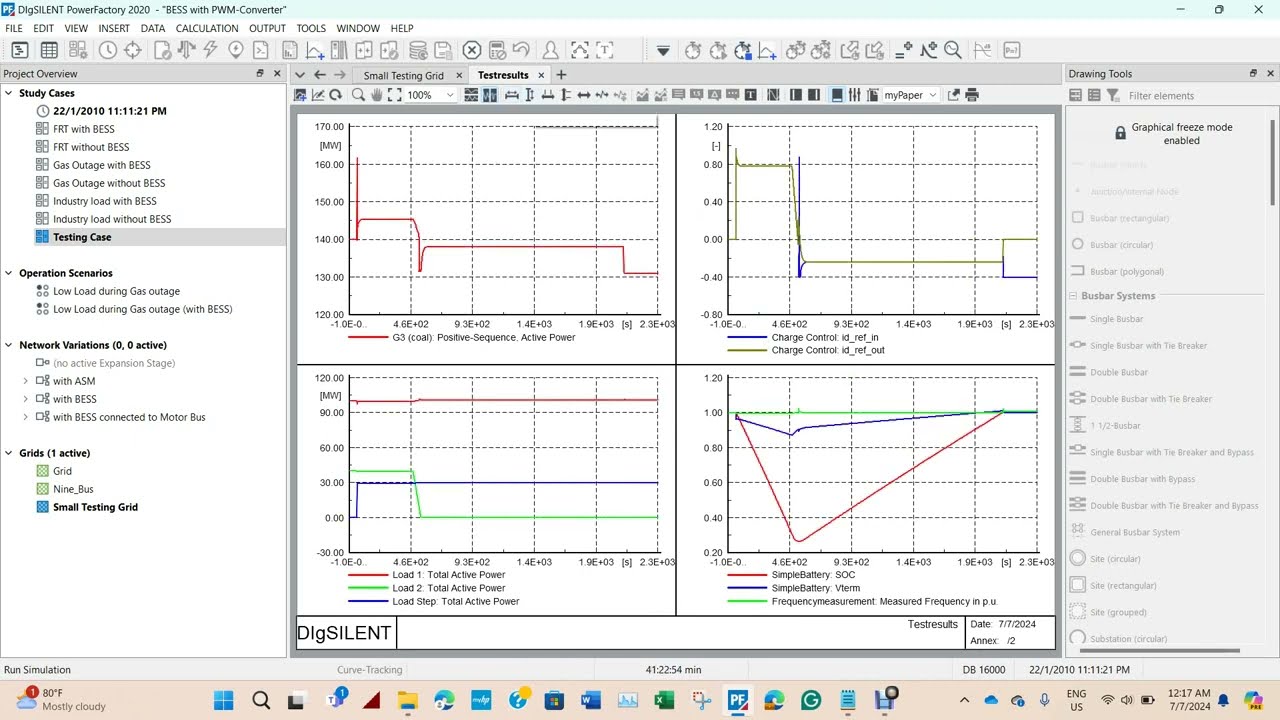
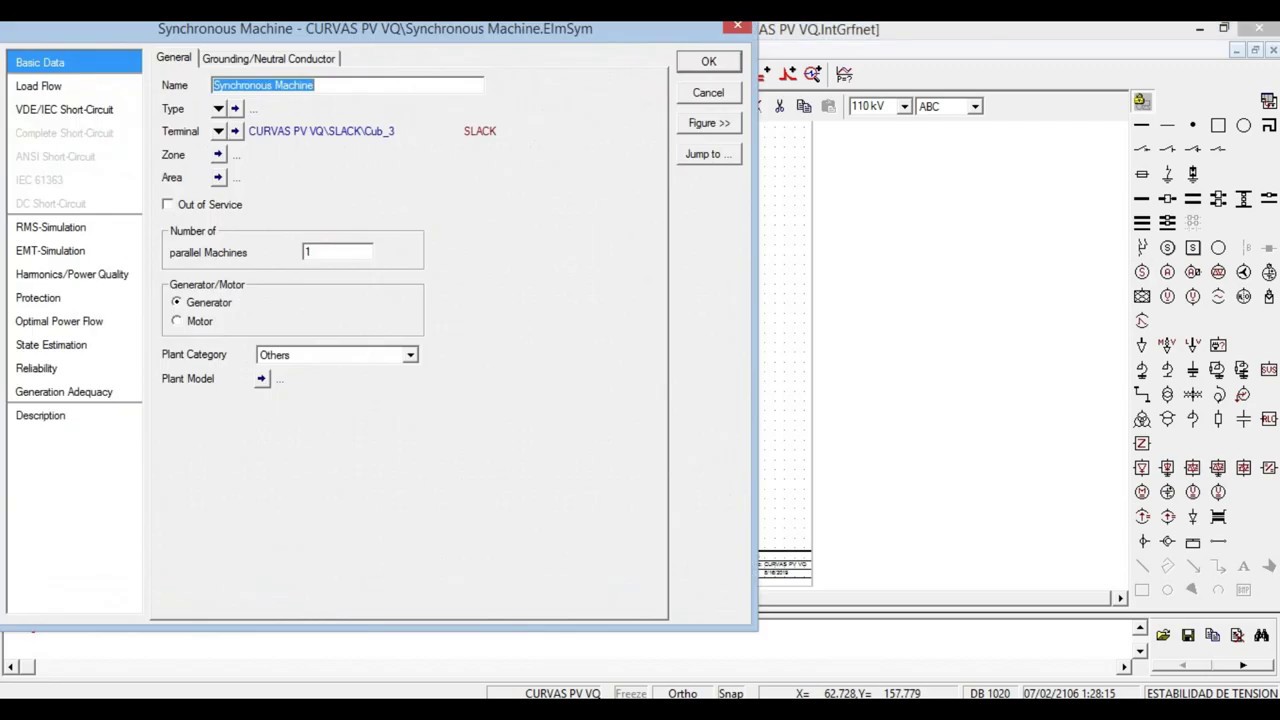
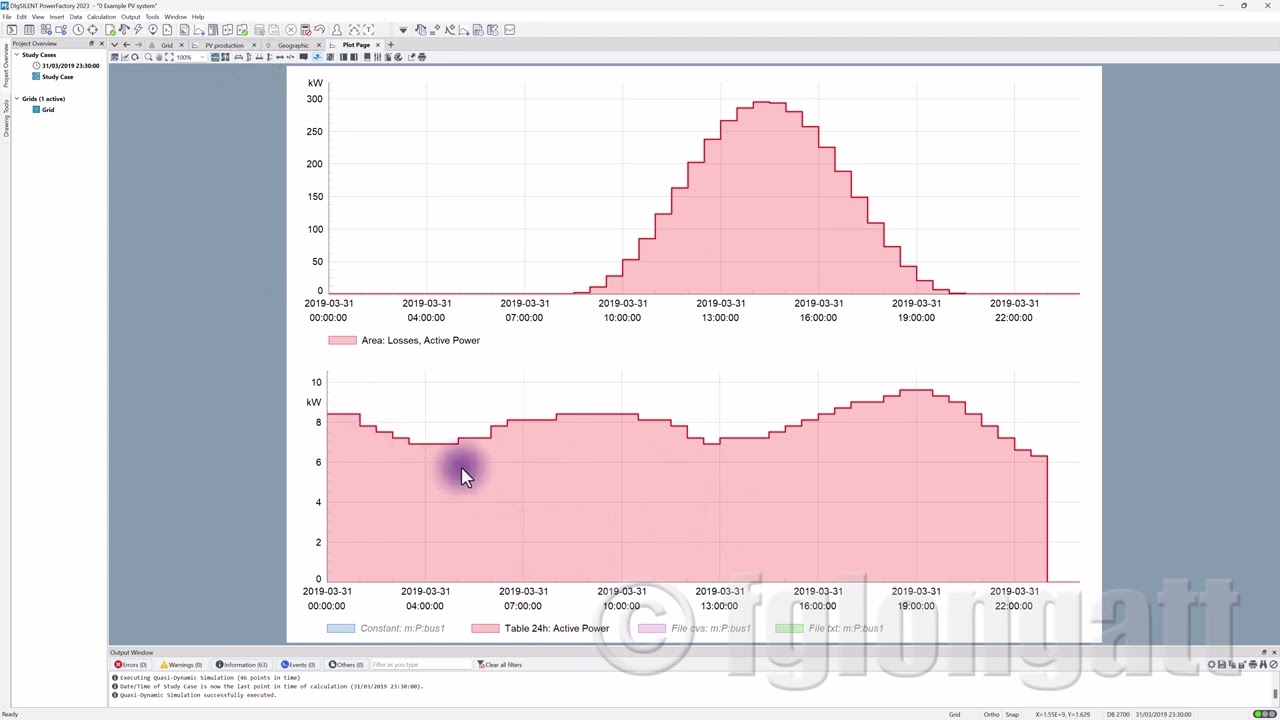
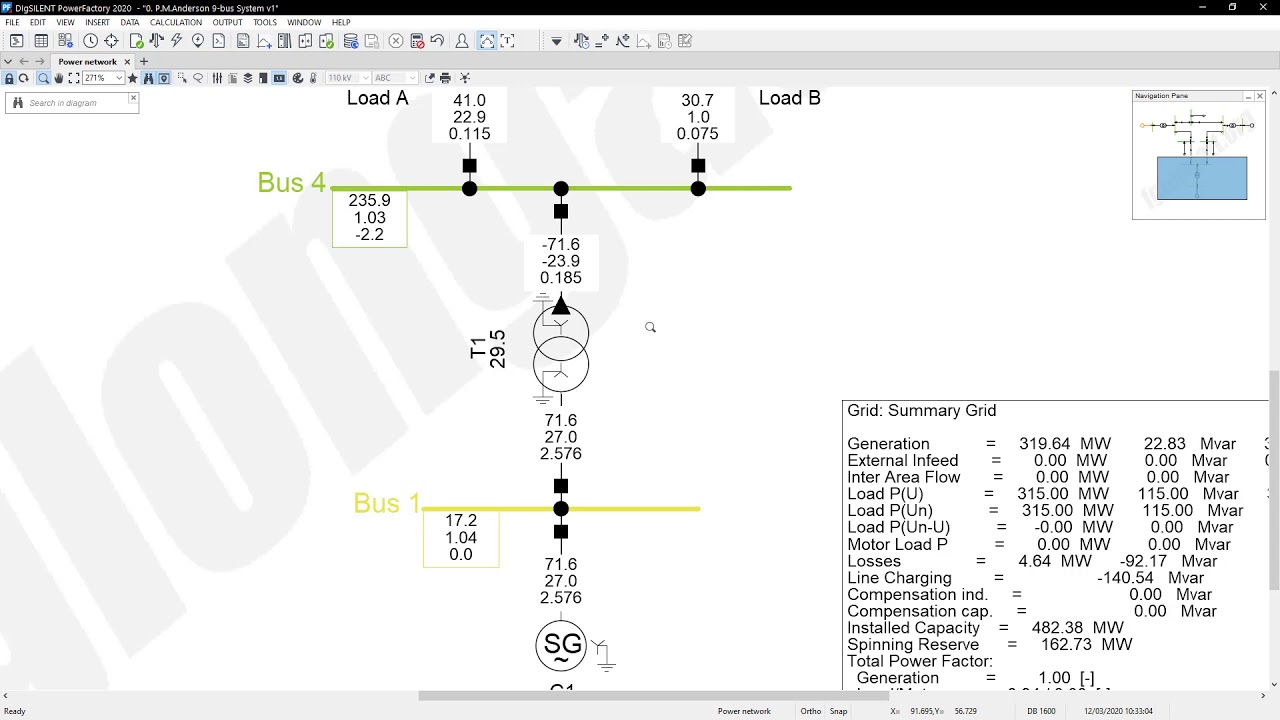
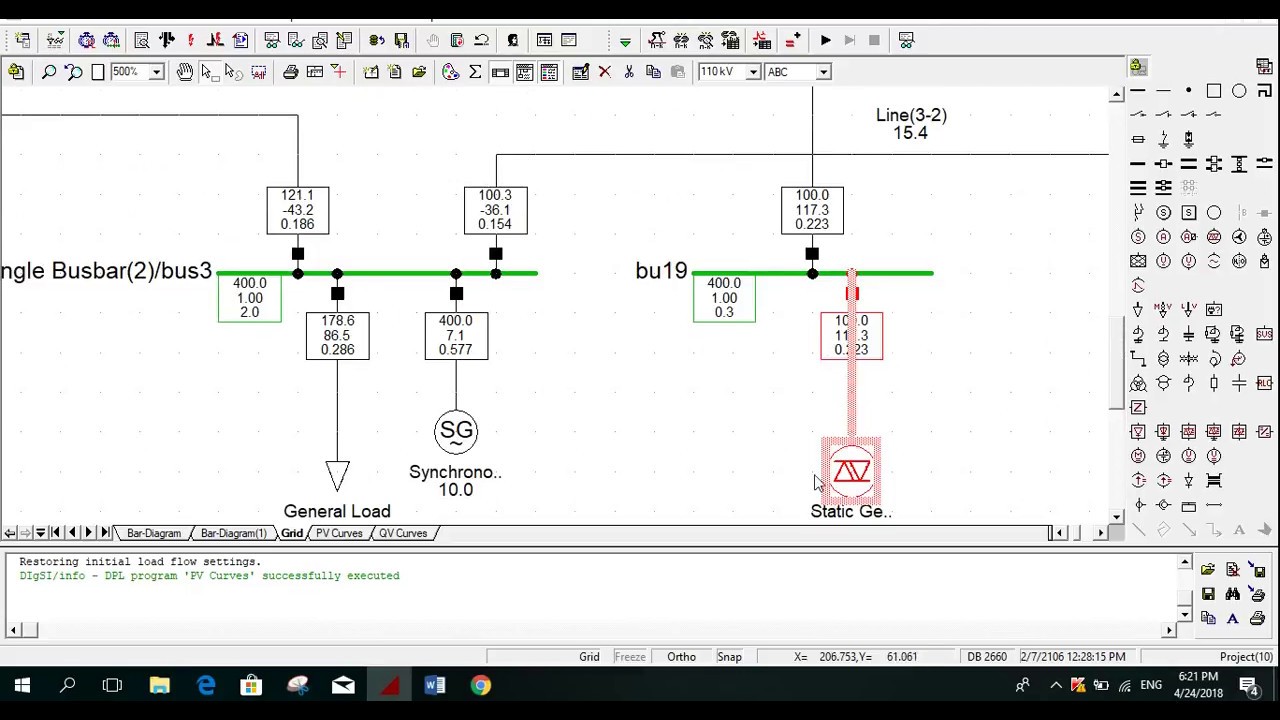
In this video, I’ll demonstrate how to plot P-V and Q-V curves in DigSILENT PowerFactory, a crucial skill for analyzing voltage stability in power systems.
📌 What You’ll Learn:
How to set up and run a load flow analysis in DigSILENT PowerFactory
Plotting P-V and Q-V curves to assess voltage stability
Interpreting the results to identify critical operating points
Tips for optimizing your power system design
🔧 Perfect For:
Power system engineers
Students learning DigSILENT PowerFactory
Researchers analyzing voltage stability
Professionals working on grid reliability and optimization
📂 Software Used: DigSILENT PowerFactory
📚 Related Topics: Voltage stability analysis, load flow studies, power system reliability, DigSILENT PowerFactory best practices
If you have any questions or suggestions, feel free to leave them in the comments below. Let’s dive in and master voltage stability analysis with DigSILENT PowerFactory!
Доступные форматы для скачивания:
Скачать видео mp4
-
Информация по загрузке: