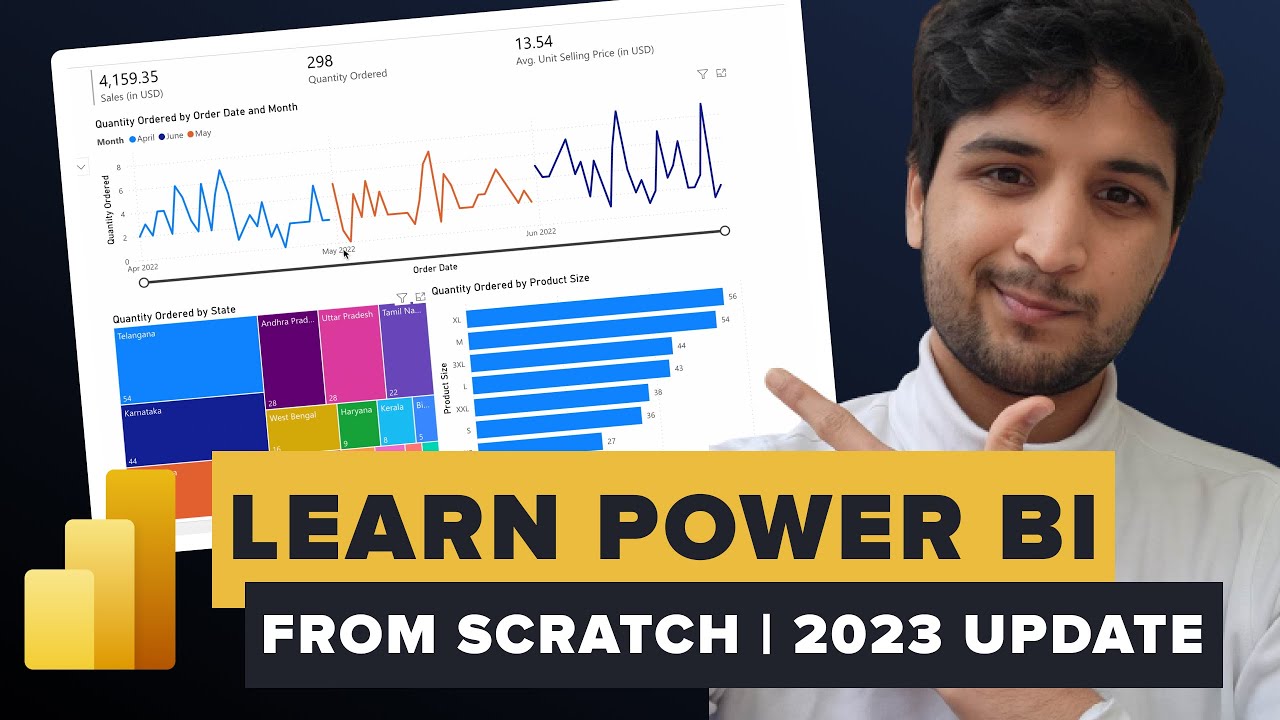
Build an Amazon Retail Analytics Report with Microsoft Power BI | Beginner Friendly | 2023 Update
Автор: DubsTech
Загружено: 2023-02-22
Просмотров: 3339
Want to learn how to use Microsoft Power BI to create interactive data visualizations? In this workshop, we will create a retail analytics report for a business selling goods on Amazon. You'll learn how to create bar charts, line charts, scatter plots, tooltips, cards, slicers, and more! Watch the full video to learn more.
Design Buddies is a community where you level up your design career. Make lifelong friends, improve your design craft, and land jobs. We have free resources, events, design challenges, a job board, fun perks, and more. Hop in here: / discord
🔗 IMP LINKS
Setup Instructions: https://rb.gy/zdur
Dataset: https://docs.google.com/spreadsheets/...
Class Website: bit.ly/DataVizClass23
Join the DubsTech Discord: bit.ly/dubstechdiscord
🍿WATCH NEXT:
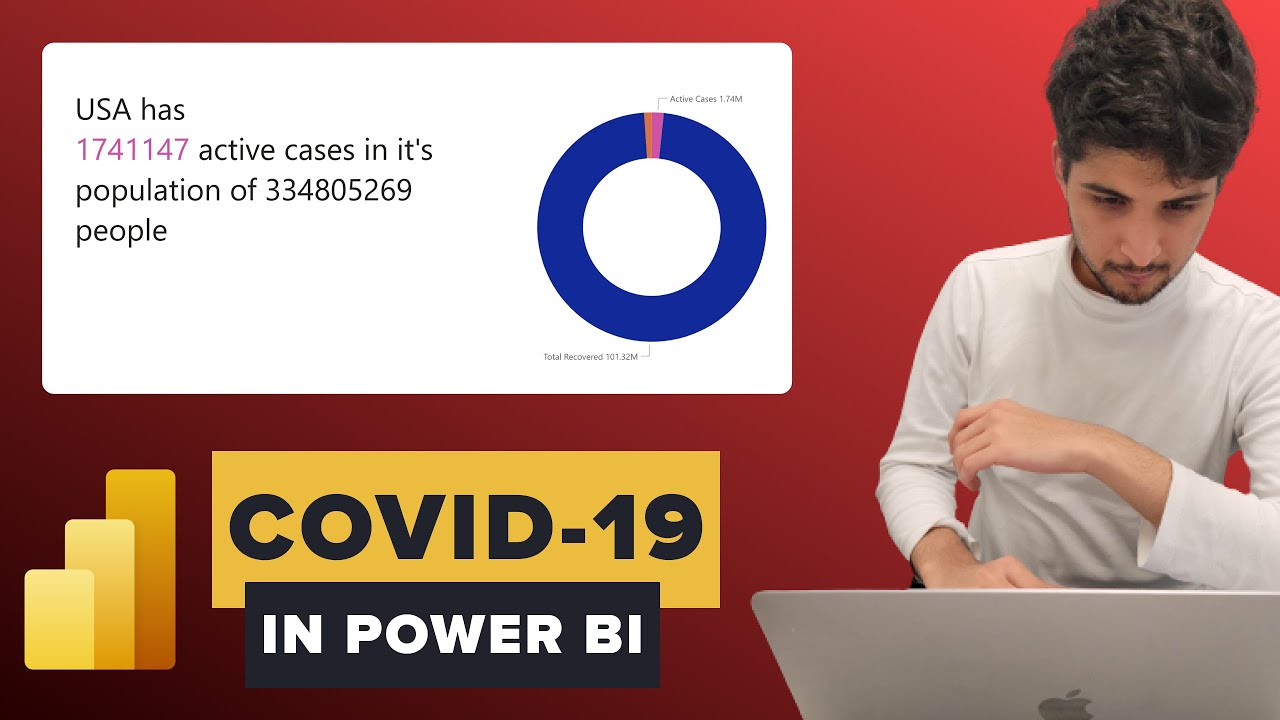
Analyzing COVID-19 with Microsoft Power BI: • Analyzing COVID-19 with Microsoft Power BI...
Build a Retail Analytics BI Report with Microsoft Power BI: • Build a Retail Analytics BI Report with Mi...
Build a Hospital Dashboard w/Tableau: • Build a Hospital Dashboard w/Tableau | Por...
🛠️ OUR FAVORITE TOOLS
Tableau - https://www.tableau.com/products/public
Power BI - https://powerbi.microsoft.com/en-us/p...
Figma - https://www.figma.com/
💻 WHAT IS DUBSTECH?
DubsTech is a student club at the University of Washington focussed on accelerating people’s careers in tech. We host free workshops, talks, and hackathons on data science, UX design, software engineering, and cyber security.
🌍 Join our community on Discord: / discord
💌 Follow us on Instagram to learn about our Free Certificate Workshops: / dubstechuw
Доступные форматы для скачивания:
Скачать видео mp4
-
Информация по загрузке: