xViz Hierarchical Tree/Hierarchy Tree- The Custom Visual for Microsoft Power BI
Автор: xViz
Загружено: 2020-03-28
Просмотров: 14002
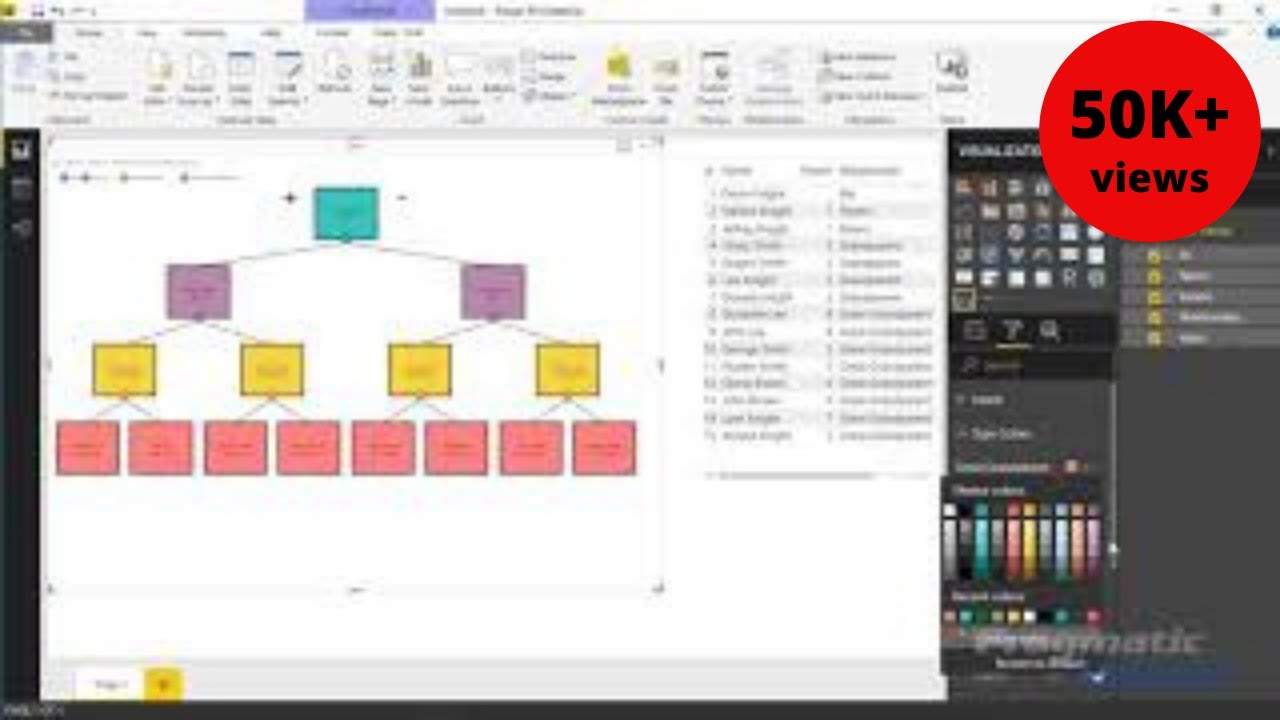
The xViz Hierarchy Tree/Decomposition Tree for Power BI is an advanced custom visual that shows hierarchies in a more visually appealing manner. Hierarchy Tree can handle multiple measures with advanced conditional formatting, render larger trees with continuous scroll, easy navigation with zoom, mini-map and search capabilities.
There are robust display options with the ability to show variance between actual vs budget or forecast (dual measure comparison), contribution % to children or root level parent, and child count. It also provides flexible customization options with Progress bars, Number Formatting, appearance, font, and Tooltip.
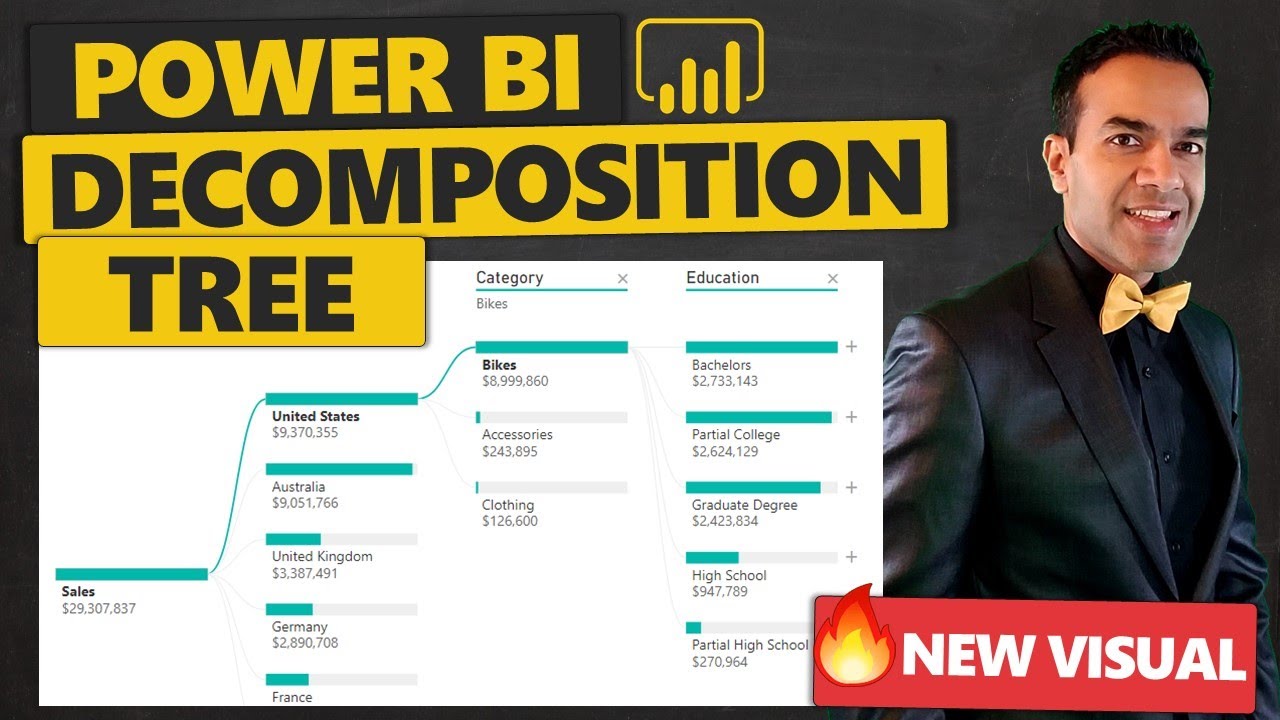
In short, xViz Hierarchy Tree is nothing but an advanced version of Power BI’s standard Decomposition Tree.
For downloadable demos (.pbix files): https://xviz.com/visuals/hierarchical...
Listed below are some of the frequently requested features in Power BI Ideas Place and Community.
1. Visualizing Hierarchies
2. Percentage (%) Contribution
3. % and Absolute Variance
4. Progress Bar
5. Mini Map
6. Alerts
7. Conditional Formatting
8. Search Function
9. Expand on Demand
10. Runtime Configuration
Read more about Hierarchy Tree in our latest blog: https://xviz.com/blogs/hierarchical-t...
Fallen in love with xViz Visuals? Get yours here now - xviz.com/pricing
Join our online community and get all your questions answered at :
https://community.xviz.com/
***
To receive regular updates Follow Us:
Twitter: / xvizsuite
LinkedIn: / xviz
***

Доступные форматы для скачивания:
Скачать видео mp4
-
Информация по загрузке: