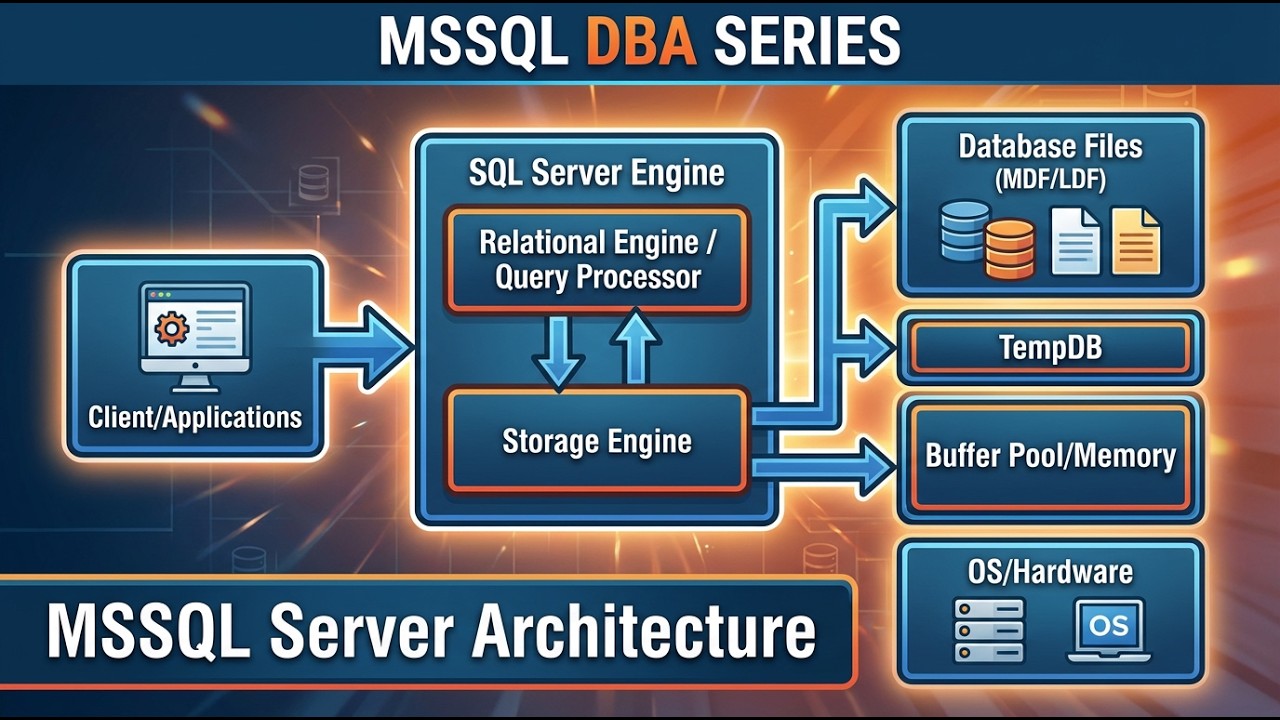
SNHA23: Troubleshoot slow synchronization in AG cluster due to network latency
Автор: ARSLANOV
Загружено: 2025-06-08
Просмотров: 306
This is a comprehensive session on diagnosing and addressing network latency issues in SQL Server Availability Group (AG) clusters. It begins with an overview of the synchronization process in AG clusters, detailing the steps involved in transaction logging, compression, remote hardening, and data transfer between primary and secondary SQL Server instances. It explains why network latency happens, illustrating scenarios such as normal cases, slow networks, packet drops, and reaching network bandwidth limits. The impact of network latency on AG clusters is discussed, highlighting how it affects transaction processes and data integrity. The session outlines troubleshooting steps for diagnosing network issues, including identifying big log send queue sizes, comparing log flush rates, and checking for packet drops and bandwidth limits. It also provides a flowchart for addressing network latency problems.
The presentation describes the stages of impact due to network latency, from slow transactions and decreased local flush in the primary server to asynchronous mode in the secondary server and possible data loss warnings. It presents different scenarios related to network latency, such as reaching bandwidth limits, network slowness, and packet drops. This presentation is a valuable resource for anyone looking to understand and troubleshoot network latency issues in SQL Server AG clusters, providing detailed diagrams, flowcharts, and explanations to help diagnose and address these problems effectively.
Chapters:
0:00 - Synchronization process in Availability Group cluster
1:51 - Why network latency happens? (Slow network, Packet drop, Bandwidth limit)
3:07 - How network latency impacts AG cluster? (HADR_SYNC_COMMIT, Slow queries, Slow disk flush rate)
11:19 - Flow control gates, Log send queue size, Possible data loss
13:17 -Troubleshooting steps
14:15 - Scenario 1: Reaching bandwidth limit
20:12 - Scenario 2: Packet drop
23:58 - Scenario 3: Network slowness
🧑💼►Follow me on LinkedIn - / bobirmirzo-arslanov-548960173
Full course sessions:
🚀► • Learning path: SQL Server Availability Gro...
🧑💼►Follow me on Youtube
🧑💼►Follow me on LinkedIn - / bobirmirzo-arslanov-548960173
Full course sessions:
🚀► • Learning path: SQL Server Availability Gro...
Watch all my playlists here:
🚀►Full course on Troubleshooting sessions: • Troubleshooting
🚀►Full course on Encrypting connections to SQL Server- • Full course on Encrypting connections to S...
🚀 ►SQL Server replication session: • SQL Server replication
🚀 ►SQL Server Always On Availability Group: • SQL Server Always On Availability Groups (AG)
🚀 ► SQL Server internals: • SQL Internals
🚀 ► Course in On-memory OLTP: • Course on In-Memory OLTP
Query:
--CHECK SESSIONS
SELECT
req.session_id
, req.total_elapsed_time AS duration_ms
, req.cpu_time AS cpu_time_ms
, req.wait_type
, req.wait_time
, req.total_elapsed_time - req.cpu_time AS wait_time
, req.logical_reads
, SUBSTRING (REPLACE (REPLACE (SUBSTRING (ST.text, (req.statement_start_offset/2) + 1,
((CASE statement_end_offset
WHEN -1
THEN DATALENGTH(ST.text)
ELSE req.statement_end_offset
END - req.statement_start_offset)/2) + 1) , CHAR(10), ' '), CHAR(13), ' '),
1, 512) AS statement_text
FROM sys.dm_exec_requests AS req
CROSS APPLY sys.dm_exec_sql_text(req.sql_handle) AS ST
ORDER BY total_elapsed_time DESC;

Доступные форматы для скачивания:
Скачать видео mp4
-
Информация по загрузке: