How to plot Satellite Antenna Transmit Radiation Pattern using Microsoft Excel
Автор: Dhiraj Kumar
Загружено: 2017-09-02
Просмотров: 2675
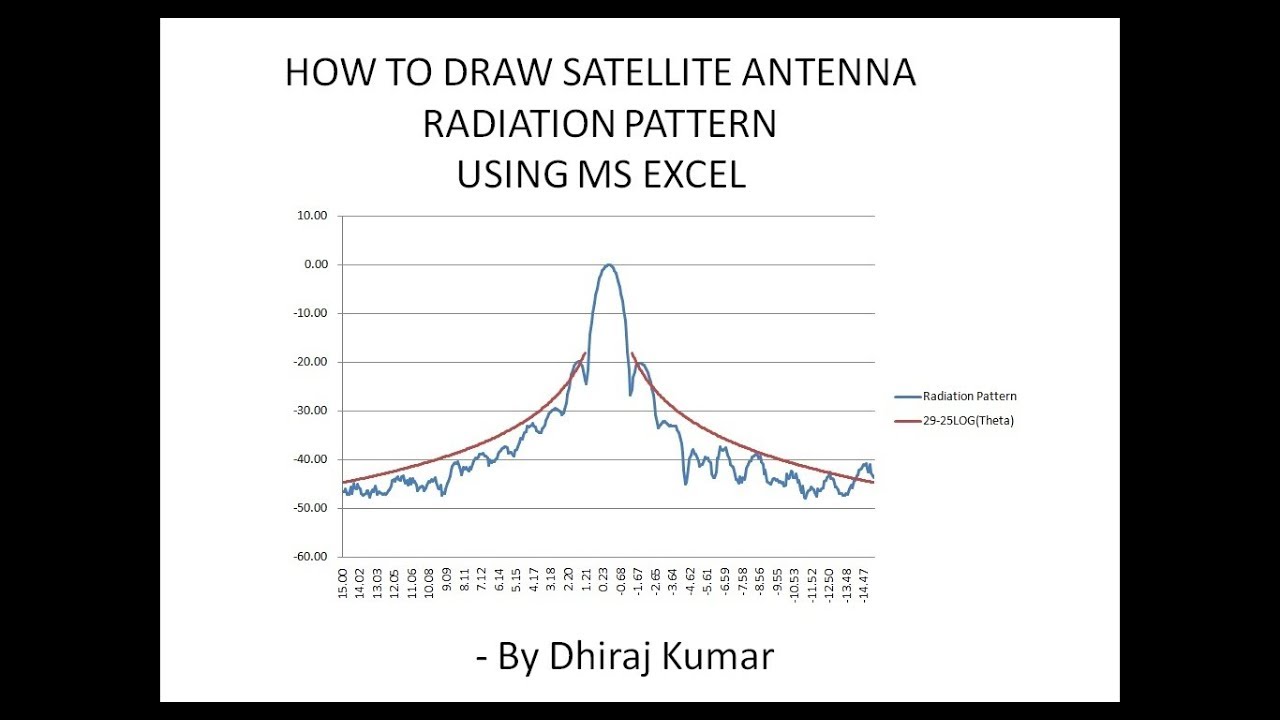
This tutorial will help understand use of MS Excel to draw Satellite Antenna Transmit Pattern from the captured .CSV file and superimpose the 29-25LOG(Theta). Once the plots are drawn, 3dB and 15dB beamwidth can be calculated and lastly the antenna Transmit Gain.
The .CSV file is saved earlier by rotating the 3.8 meter Prodelin make offset Tx/Rx antenna. This method of drawing 29-25LOG(Theta) can be used where OEM/Proprietary software is not available.
Antenna is being tested for Mandatory Performance Verification Test (MPVT) in India by rotating the Satellite Antenna for all three axis. The antenna is said to clear the MPVT when all electrical parameters are within the specified limits. Satellite antenna is then being registered with Indian Regulatory Authority to be used in India for Teleport, Static, DSNG, Flyaway, etc.
Other Satellite Operators do not follow this tedious method to get the antenna registered for used on their Satellites
Comments are most welcomed.
My Linkedin profile: / dhiraj-kumar-pmp-a3138ba8
***We don't own any copyrights of the music used in the video
Доступные форматы для скачивания:
Скачать видео mp4
-
Информация по загрузке:


![Как сжимаются изображения? [46 МБ ↘↘ 4,07 МБ] JPEG в деталях](https://image.4k-video.ru/id-video/Kv1Hiv3ox8I)


