Master Sales Insights & Planning with This Excel Dashboard | Sales Strategy in Action
Автор: Other Level’s
Загружено: 2020-10-17
Просмотров: 62077
https://www.other-levels.com
🌍 🏅 The #1 Website Worldwide for Excel Dashboard Templates, Reports, and Professional Analysis Tools.
🎖️ 🏆 Other Levels YouTube Channel — The #1 Authority for Excel Dashboards on YouTube, with over 24 million views and a global impact.
💼 Other Levels Services
Custom Excel Dashboard Service https://other-levels.com/products/cus...
Enhance Your Templates Service https://other-levels.com/products/enh...
🎓 Master Excel Dashboards
Join over 100,000 learners in our top-rated online course and gain the skills to create professional Excel dashboards from scratch.
👉 Enroll today: https://other-levels.com/products/mas...
To watch the full Tutorials? Join our channel Membership / @otherlevels
🎓 Free Excel Courses On YouTube:
Single Dynamic Excel Dashboard • Single Dynamic Excel Dashboard
Multiple Dynamic Excel Dashboards • Multiple Dynamic Excel Dashboards
Have a question about this template?
👇🏻Comment down below
Let’s connect on social
LinkedIn / other-levels-com
Facebook / other.levels.official
Instagram / other.levels
TikTok / other.levels
Playlists
Data Analysis By Power Point / watch
PowerPoint Slides / watch
CV/Resume Templates / watch
Organizational Structure Chart / watch
PowerPoint Templates / watch
PowerPoint Dashboard / watch
Modern Excel Reports / watch
⭐️ Sales Analysis & Action Plans Roadmap Excel Dashboard
Take control of your business growth with the Dynamic Sales Analysis Dashboard & Action Plans Roadmap, an all-in-one Excel solution developed by Other Levels. This powerful Excel dashboard helps business leaders, analysts, and sales managers monitor performance, identify opportunities, and implement action plans effectively.
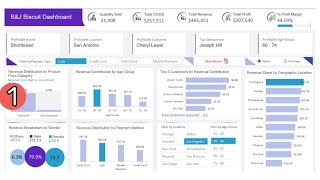
Main Sales Dashboard – Data that Drives Strategy
Visualize and understand your entire sales pipeline:
Monthly Sales & Orders (Line Chart with Peak Indicators)
Branch-Wise Sales Breakdown
Income Growth Across Branches
Top 4 Products by Units Sold & Revenue
Dashboard Feedback & Performance Commentary
Yearly Slicer for Filtered Analysis
Action Plan Roadmap – Stay on Track
Plan, track, and achieve with a visual dashboard built for execution:
Real-Time Roadmap Status
Last Updated Action Items
Progress Monitoring & Milestone Tracking
Linked to External Data Table (Unaffected by slicers)
Why Professionals Choose This Dashboard
Easy-to-navigate Excel interface with sleek visuals
Fully interactive with slicers, pivot tables & prebuilt formulas
Ideal for data-driven strategy meetings & reporting
No coding or advanced tools required
Includes a YouTube tutorial for instant onboarding
Whether you're optimizing daily sales or leading quarterly business reviews, this Excel Dashboard gives you the insights and structure needed to reach your sales and operational targets.
00:00 Excel Dashboard Overview
00:51 Get Templates at other-levels.com
01:00 Start Creating Excel Dashboard Step by Step
#SalesDashboard #ExcelSalesAnalysis #ActionPlanDashboard #BranchSales #TopSellingProducts #SalesKPI #BusinessGrowthTools #ExcelDashboard #SalesReporting #StrategicPlanning

Доступные форматы для скачивания:
Скачать видео mp4
-
Информация по загрузке:


![Ultimate Data Analyst Bootcamp [24 Hours!] for FREE | SQL, Excel, Tableau, Power BI, Python, Azure](https://ricktube.ru/thumbnail/wQQR60KtnFY/mqdefault.jpg)