Скачать
Create a scatter plot using R programming. How to use ggplot for data visualisation.
Автор: R Programming 101
Загружено: 6 апр. 2021 г.
Просмотров: 23 144 просмотра
Описание:
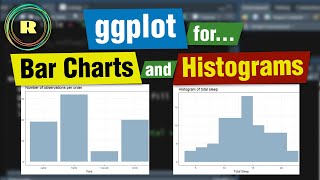
Using R programming for data visualisation is easy. If you want to create a scatter plot for two or
more numeric variables, ggplot is perfect package. Ggplot2 is part of the tidyverse set up packages.
This video is part of a series that considers creating graphs and plots to visualise data. If you’re
interested in data science or statistics and want to learn how to use R programming, this video is for
you. Whatever your research project, creating graphs and plots to visualise your data is important.
This video also includes using a smoothed linear model with standard errors to indicate trends.

Доступные форматы для скачивания:
Скачать видео mp4
-
Информация по загрузке: