How To Create Interactive Image Grids In Power BI Using Wikidata (Interactive Art Gallery)
Автор: Data For Knowledge
Загружено: 2022-08-13
Просмотров: 3374
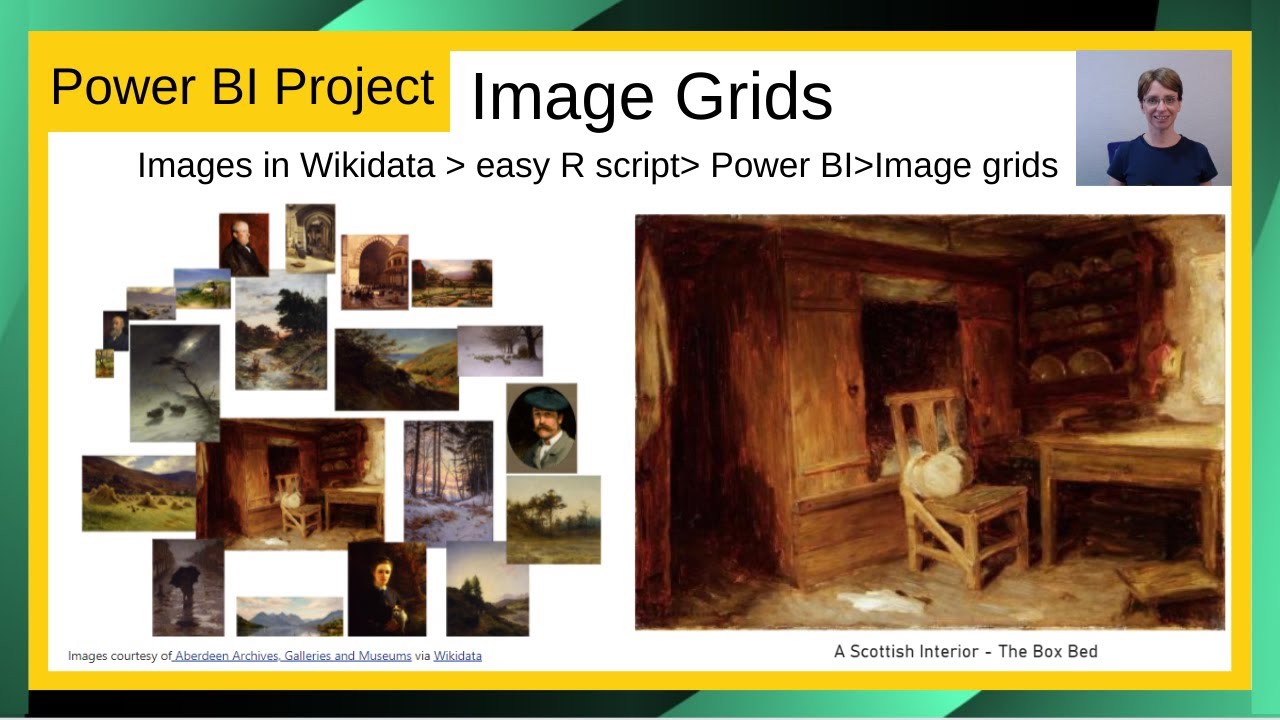
Learn how to build stunning interactive image grids in Power BI by pulling artwork data directly from Wikidata! This Power BI tutorial shows you how to create a dynamic art gallery visualization where users can browse, filter, and interact with images in a responsive grid layout.
We'll use R scripts to import artwork data from Wikidata into Power BI, then transform that data into an interactive image grid that brings your visualizations to life. You'll see how to add slicer functionality so users can filter artwork by artist, create clickable images that expand for detailed views, and integrate direct links to the Aberdeen Archives, Galleries, and Museums website for additional information.
The combination of Wikidata, R scripts, and Power BI makes creating these interactive image grids surprisingly straightforward, giving you a powerful way to visualize art collections, product catalogs, or any image-based dataset. This Power BI image grid technique transforms static data into an engaging, clickable gallery experience that users can explore and filter based on their interests.
The wikidata query used in this project can be found at https://w.wiki/5YVz
⏱️ Timestamps:
00:00 Intro to project - How to create image grids
01:00 Steps required to display images
01:35 Gather the data in Wikidata
04:30 Requirements to use R code in Power BI
05:30 R code script
08:10 Explore the data
15:20 Filter page - remove entries with no artist
15:50 Add artists slicer
18:40 Update data categories of URLs
19:25 Add Image Grid
21:00 Add larger image grid
23:00 Add description using a card
24:20 Relationships between diagrams
25:00 Add text box showing image source
The video mentioned at around 4.08 relating to creating a wikidata query for a shipwrecks project can be found at • How to create a Wikidata Query using SPARQ...
Helpful link:
How to configure R for use in Power BI (half way down the page)- https://docs.microsoft.com/en-us/powe...
This project arose from a hackathon held in Aberdeen, UK in February 2022. More information on the project can be found at https://dataforknowledge.co.uk/using-...
Note: As 3rd party data is used in this project, I can accept no responsibility for the quality or accuracy of the data and/or resulting output from the code.
#powerbi #datavisualisation #datavisualization #powerbitutorial #wikidata
I am grateful to Aberdeen Archives, Museums and Galleries (AAGM) https://www.aberdeencity.gov.uk/AAGM for making the images available in Wikidata (https://www.wikidata.org/wiki/Wikidat...) and Wikimedia Commons (https://commons.wikimedia.org/wiki/Ma....
🔔 Like and subscribe to the channel for more Power BI tips and tutorials!
/ @dfk_data
💥 For more Power BI tutorials check out the playlists:
• Power BI Tutorials | Learn DAX, Charts, AP...
• Power BI projects
🔥 Popular Power BI tutorials:
• How to Add Emojis and Symbols in Power BI ...
• How to Combine Diagrams in Power BI | Grou...
• How to Navigate Line Diagrams in Power BI ...
👉 Follow me on LinkedIn: www.linkedin.com/in/pauline-cairns-data
#PowerBI #Wikidata #ImageGrid #PowerBITutorial #RScript #DataVisualization #InteractiveGallery #PowerBIVisuals #WikidataQuery #ArtVisualization #PowerBIDesign #ClickableImages #DataArt #PowerBITips #VisualizationDesign
Доступные форматы для скачивания:
Скачать видео mp4
-
Информация по загрузке:
![Power BI - Link Images to Your Reports [How to]](https://image.4k-video.ru/id-video/oecewrHhPDA)


