Скачать
How to Create Charts in Excel (Step-by-Step) | Types of Charts & Graphs | AIOU ICT Lectures
Автор: Classroom & Beyond
Загружено: 2026-01-16
Просмотров: 5
Описание:
In this video, we see MS Excel Charts for the AIOU ICT course. Charts are the best way to visualize data, and they are a frequent topic in AIOU assignments and final exams.
What you will learn:
Introduction to Excel Charts.
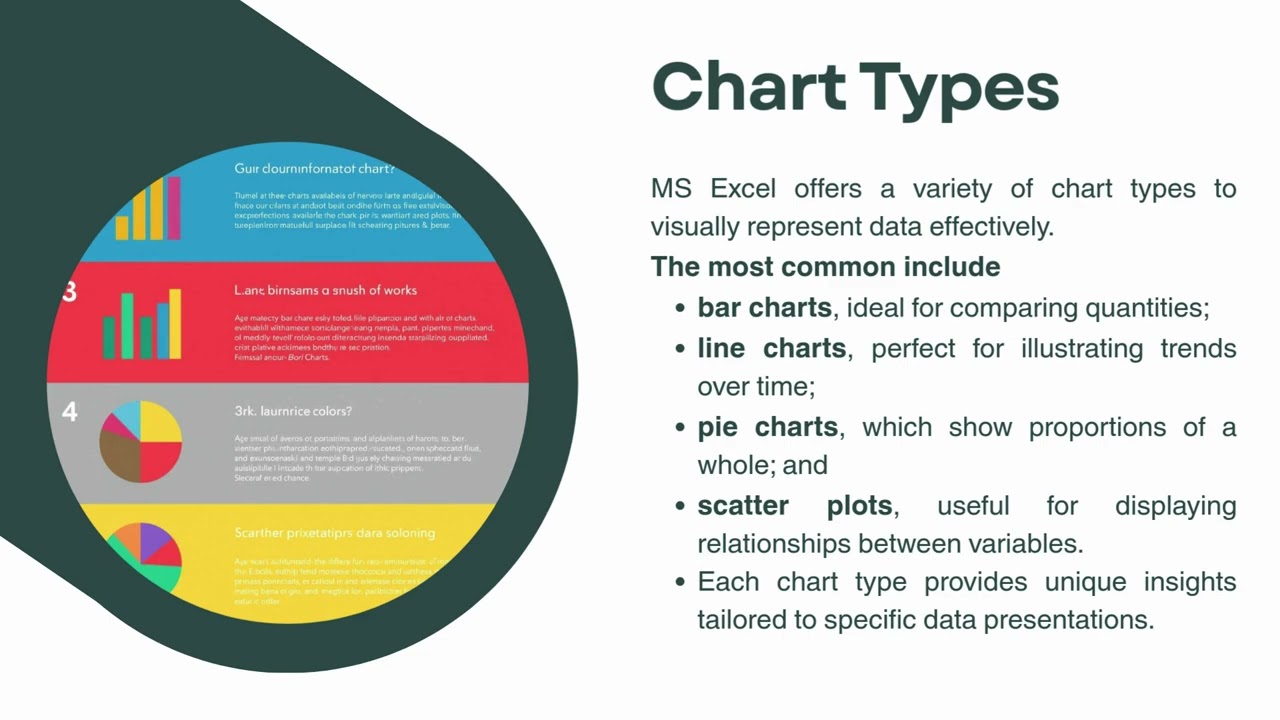
Understanding Different Types of Charts (Column, Bar, Line, Pie).
Which chart to use for which data?
Step-by-step: How to Insert and Customize a Chart.
Practice tips for AIOU Course Code 1431 and 5403.
🔔 Subscribe for the full AIOU ICT Course!
#AIOU #ExcelCharts #ICT1429 #ICT5403 #ExcelTutorial #ComputerScience #AIOUAssignments #LearnExcel #AllamaIqbalOpenUniversity
Доступные форматы для скачивания:
Скачать видео mp4
-
Информация по загрузке:


![ChatGPT и Gemini устарели. Вот реально рабочий инструмент [Opal]](https://image.4k-video.ru/id-video/0RvCVXVMftE)