Скачать
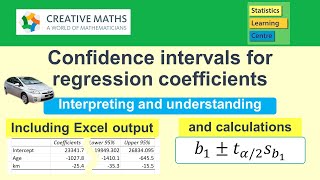
Creating Confidence Intervals for Linear Regression in EXCEL
Автор: ME4031
Загружено: 2010-02-20
Просмотров: 117582
Описание:
This video tutorial shows how to create confidence intervals for linear regressions using EXCEL. It was created for the ME4031, an undergraduate class in Mechanical Engineering at the University of Minnesota.

Доступные форматы для скачивания:
Скачать видео mp4
-
Информация по загрузке: