How to Calculate a Correlation Matrix in Excel (Three or More Variables)
Автор: Quantitative Specialists
Загружено: 2014-09-30
Просмотров: 233199
Check out our brand-new Excel Statistics Text: https://www.amazon.com/dp/B076FNTZCV
This video illustrates how to calculate a correlation in Excel on three variables using the Data Analysis Toolpak.
YouTube Channel: / statisticsinstructor
Correlation in Excel
Data Analysis ToolPak
Pearson Correlation in Microsoft Excel
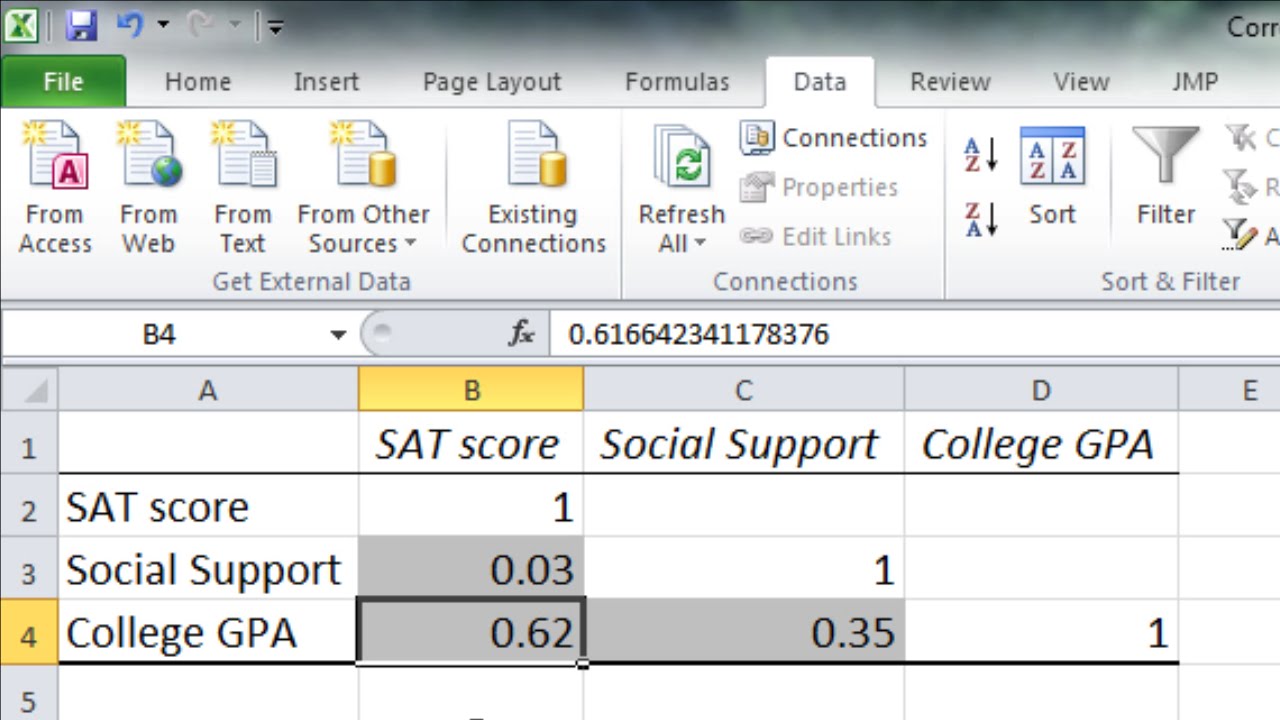
Video Transcript: In this video I want to take a look at how to calculate the correlation coefficient in Microsoft Excel when I have more than two variables. So in this example I have SAT score, social support and this was recorded in college, and then college GPA. So we have three variables and what I want to do is get the correlation between all pairs of variables. So the correlation of SAT with social support, the correlation of SAT with college GPA, and then the correlation of social support with college GPA. So to do that I want to go ahead and select Data and then Data Analysis and then when this window opens up I want to go to Correlation and then click OK. Now here I need to select the area of my variables and it's already selected here but let's go ahead and redo that. So start with the first label SAT score and scroll all the way down until we have all the data selected. Notice that says B1 through D31 so those are all the cells that are of interest. And then notice that I've gone ahead and selected my labels which I wanted to do so I want to make sure I check this box Labels in First Row and then notice it says Grouped by Columns and that's right each variable is in a separate column so that looks great so let's go ahead and click OK. And it opens up the results in a new worksheet. I'm going to go ahead and expand these columns by double-clicking on them so we can see the information better here and then I'll also go ahead and dial down these decimal places here and we'll just take them to two decimal places. OK now I'm going to highlight the correlation coefficients so they're easier to see. And then let's go ahead and make this font a little larger as well so it's easier to see and I'll have to re- expand just a bit more. OK so these are our correlation results and notice here I have SAT Score, Social Support, and College GPA and here where a column intersects with a row that indicates the correlation. So the correlation .03 is the correlation or relationship between the SAT score and social support and that's very small. And then SAT correlates with college GPA .62 which is much higher that's a pretty strong correlation. And then finally social support correlates with college GPA .35. Now in this video what we're looking at when we're calculating the Pearson correlation coefficient which is what this is. When we run this analysis in Excel we get these correlation coefficients output it's important to note here that all we're getting is the descriptive statistic or the correlation between the two variables. But we haven't tested these for statistical significance. So while we know that the correlation here between college GPA and SAT scores .62 we don't know for certain at this point whether that correlation is significantly different from zero. It probably is just from experience here but we don't know that by looking at this alone and we don't know for example is .35 statistically significant this correlation between social support and college GPA. We can't tell that from this analysis. To know that we need to run another procedure in Excel which I've done in another video which I'll link to in this video for those who are interested. But it is important to be aware of here that running this procedure while definitely worthwhile it doesn't state whether a given correlation is statistically significant or not. So in other words we don't know whether this .35 is significantly different from zero or no relationship. We need to establish that by conducting a hypothesis test and unfortunately in Microsoft Excel it doesn't come out automatically when you run the correlation procedure but instead we need to run a different analysis. OK that's it for running the Pearson correlation for multiple variables in Microsoft Excel. Thanks for watching.
YouTube Channel: / statisticsinstructor
Subscribe today!
Доступные форматы для скачивания:
Скачать видео mp4
-
Информация по загрузке: