🔥Excel Charts and Graphs Tutorial | How to Build Excel Interactive Dashboards | 2024 | Simplilearn
Автор: Simplilearn
Загружено: 2023-11-29
Просмотров: 6293
"🔥Data Analyst Masters Program (Discount Code - YTBE15) - https://www.simplilearn.com/data-anal...
🔥IITK - Professional Certificate Course in Data Analytics and Generative AI (India Only) - https://www.simplilearn.com/iitk-prof...
🔥Post Graduate Program in Data Analytics, delivered by Simplilearn in collaboration with Purdue University - https://www.simplilearn.com/pgp-data-...
🔥Professional Certificate in Data Science and Generative AI, delivered by Simplilearn in collaboration with Purdue University - https://www.simplilearn.com/pgp-data-...
🔥IITG - Professional Certificate Program in Data Analytics and Generative AI (India Only) - https://www.simplilearn.com/iitg-gene...
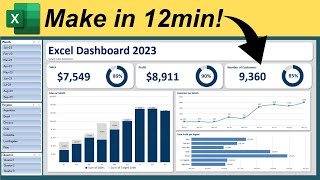
📊 Ready to take your Excel skills to the next level? Join us in this in-depth tutorial where we'll guide you through the intricacies of creating stunning charts, graphs, and dashboards in Microsoft Excel! 🚀
🔍 In this tutorial, you'll learn:
📈 Chart Essentials: Understand the fundamental types of charts and when to use them.
📊 Data Visualization Techniques: Explore effective ways to represent your data visually for better insights.
🎨 Customization Mastery: Dive into the world of formatting, colors, and styles to make your charts visually appealing.
📉 Advanced Graphs: Learn how to create advanced graphs like waterfall charts, radar charts, and more.
📂 Dashboard Creation: Turn your data into interactive dashboards that tell a compelling story.
Whether you're a beginner or an Excel enthusiast, this tutorial caters to all skill levels. Follow along with our step-by-step instructions and practical examples to build your proficiency in Excel data visualization.
✅Subscribe to our Channel to learn more about the top Technologies: https://bit.ly/2VT4WtH
⏩ Check out the Design Thinking training videos: • Design Thinking [2026 Updated]
#ChartsinExcel #ExcelChartsandGraphsTutorial #ExcelGraphsTutorial #ExcelGraphsTutorial #PieChartinExcel #BarChartInExcel #LineGraph #AreaGraph #WaterfallChart #BoxAndWhiskersChart #ExcelDashboarding #InteractiveDashboardinExcel #howtobuilddashboardsinexcel #ExcelDataAnalytics #Excel #Simplilearn #2023 #2024
➡️ About Post Graduate Program In Data Analytics
This Data Analytics Program is ideal for all working professionals and prior programming knowledge is not required. It covers topics like data analysis, data visualization, regression techniques, and supervised learning in-depth via our applied learning model with live sessions by leading practitioners and industry projects.
✅ Key Features
Post Graduate Program certificate and Alumni Association membership
Exclusive hackathons and Ask me Anything sessions by IBM
8X higher live interaction in live online classes by industry experts
Capstone from 3 domains and 14+ Data Analytics Projects with Industry datasets from Google PlayStore, Lyft, World Bank etc.
Master Classes delivered by Industry Expert and IBM experts
Simplilearn's JobAssist helps you get noticed by top hiring companies
Resume preparation and LinkedIn profile building
1:1 mock interview
Career accelerator webinars
✅ Skills Covered
Data Analytics
Statistical Analysis using Excel
Data Analysis Python and R
Data Visualization Tableau and Power BI
Linear and logistic regression modules
Clustering using kmeans
Supervised Learning
✅ Enroll Course Now: https://www.simplilearn.com/pgp-data-...
🔥🔥 Interested in Attending Live Classes? Call Us: IN - 18002127688 / US - +18445327688
👉 Listen to what millions of users say about our courses! https://www.simplilearn.com/reviews?u...
🔥Explore our FREE Courses: https://www.simplilearn.com/skillup-f...

Доступные форматы для скачивания:
Скачать видео mp4
-
Информация по загрузке: