Скачать
Understanding Regression Coefficients
Автор: Scott W. Hegerty
Загружено: 2022-04-04
Просмотров: 293
Описание:
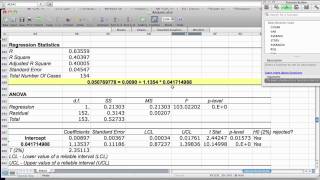
Using some simulated data in R, we run an OLS regression and interpret its output. The coefficient and standard errors generate the t-statistic, which is a measure of the distance from zero on the distribution. Large t-statistics leave less probability that the coefficient could really be zero and that it is all due to random variation, so the p-value is low. The associated .R file and more information are available at github.com/hegerty/ECON310.

Доступные форматы для скачивания:
Скачать видео mp4
-
Информация по загрузке: