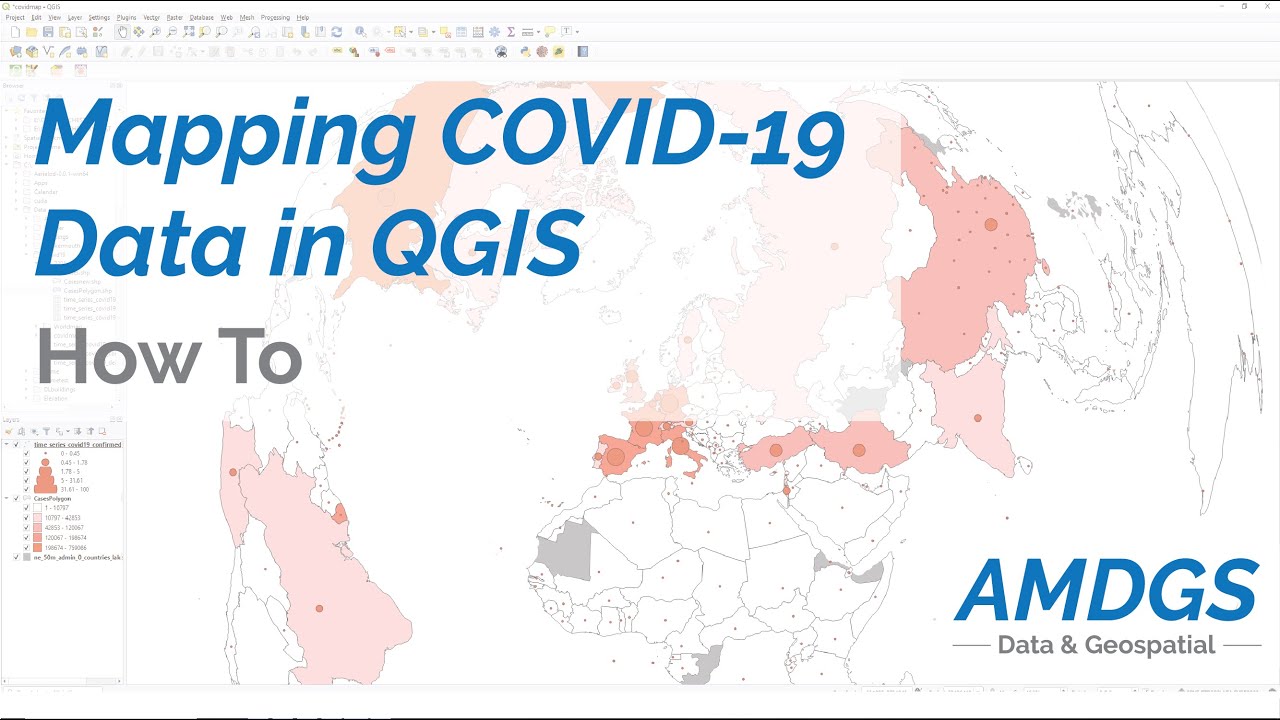
Mapping COVID-19 (novel coronavirus) case and mortality data in QGIS
Автор: AMDGS
Загружено: 2020-04-23
Просмотров: 5675
If you've been wondering how coronavirus is spreading globally, and wanting to carry out your own analysis of cases and mortality rates, this video provides a tutorial on how to map and visualise COVID-19 (novel coronavirus) case and mortality data using the free, open source GIS software QGIS.
It identifies reliable data sources for both the COVID-19 data itself and suitable base map data to combine it with, as well as the steps necessary to join the datasets together and visualise them effectively, both as a point size map and a chloropleth map (colouring polygons according to values), all using free tools available in the QGIS geographical information systems package.
Data sources for the exercise can be found at:
COVID-19 (novel coronavirus) case and mortality data: https://github.com/CSSEGISandData/COV...
Global base mapping data: https://www.naturalearthdata.com/
If you found this video helpful, please support by liking and subscribing!
Доступные форматы для скачивания:
Скачать видео mp4
-
Информация по загрузке:

![Как сжимаются изображения? [46 МБ ↘↘ 4,07 МБ] JPEG в деталях](https://image.4k-video.ru/id-video/Kv1Hiv3ox8I)


