Скачать
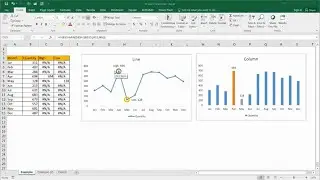
Line chart that highlights MAX and MIN values in Excel
Автор: Essential Excel
Загружено: 2019-09-03
Просмотров: 1523
Описание:
In this tutorial we show you how to create a line chart in Excel that will dynamically highlight the MAX and MIN values... the best part is that this will continue to update and correct as your data changes!
FREE eBook! 📕
https://www.EssentialExcelUK.com
Master Excel NOW 💥
https://www.udemy.com/microsoft-excel...
Instagram 🌅
/ essentialexceluk
Follow to our Facebook page 📃
/ essentialexceluk

Доступные форматы для скачивания:
Скачать видео mp4
-
Информация по загрузке: