Coffee Sales Data Analysis in Python | Pandas & Matplotlib End-to-End Project
Автор: BJ The Analyst
Загружено: 2026-01-03
Просмотров: 32
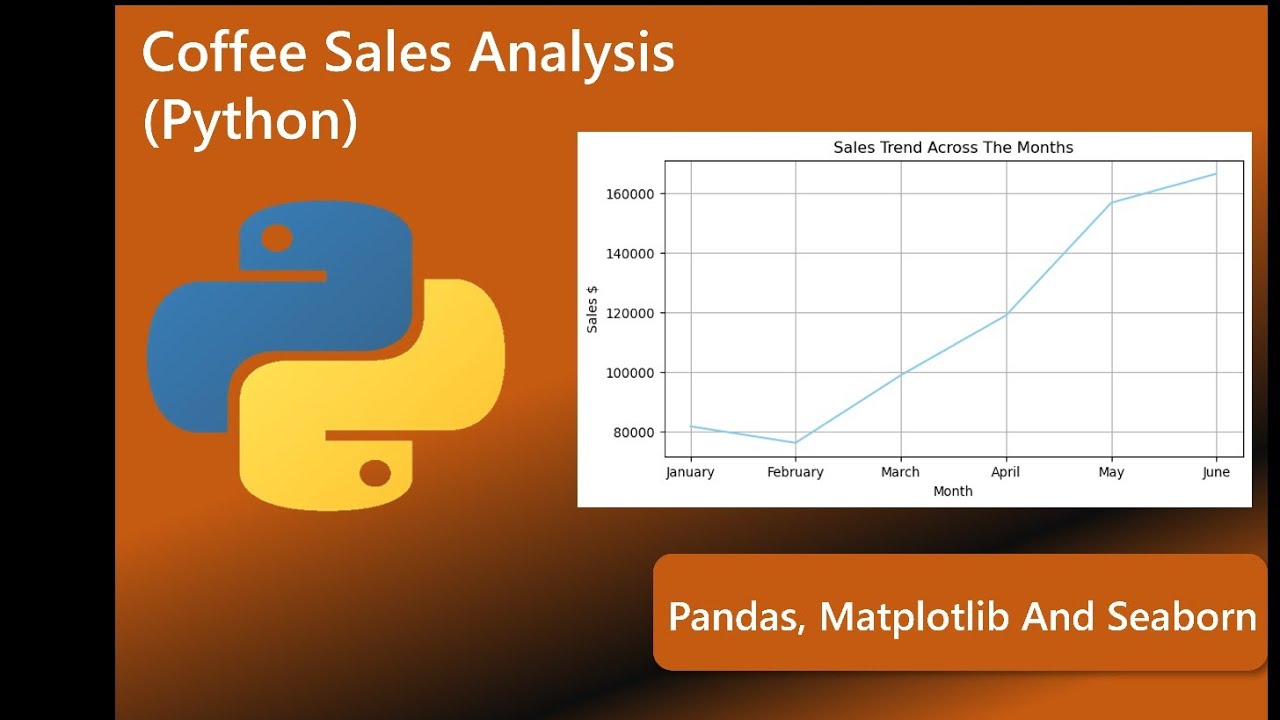
This video shows a complete coffee sales analysis using Python. The analysis is done with Pandas for data cleaning, transformation, and aggregation, and Matplotlib for visualizations.
Dataset: https://docs.google.com/spreadsheets/...
Topics covered:
☑️ Understanding a real coffee sales dataset
☑️ Data cleaning and preprocessing in Pandas
☑️ Sales trends by date and time
☑️ Revenue and quantity analysis
☑️ Product and store performance
☑️ Peak sales hours and demand patterns
☑️ Business insights derived from the analysis
☑️ Visualizing results with Matplotlib
This project reflects real-world data analysis work and is suitable for data analyst portfolios, interviews, and practical learning.
Tools used:
☑️ Python
☑️ Pandas
☑️ Matplotlib
Who this video is for:
☑️ Aspiring data analysts
☑️ Python beginners learning data analysis
☑️ Anyone building a data analytics portfolio
Keywords / Tags: python data analysis
coffee sales analysis
pandas project
matplotlib visualization
data analysis project
sales data analysis
exploratory data analysis
python for data analysts
real world data analysis
data analyst portfolio
Доступные форматы для скачивания:
Скачать видео mp4
-
Информация по загрузке:


