Home Assistant Data Visualisation with InfluxDB and Grafana
Автор: Hive Mind Automation
Загружено: 2020-11-14
Просмотров: 15599
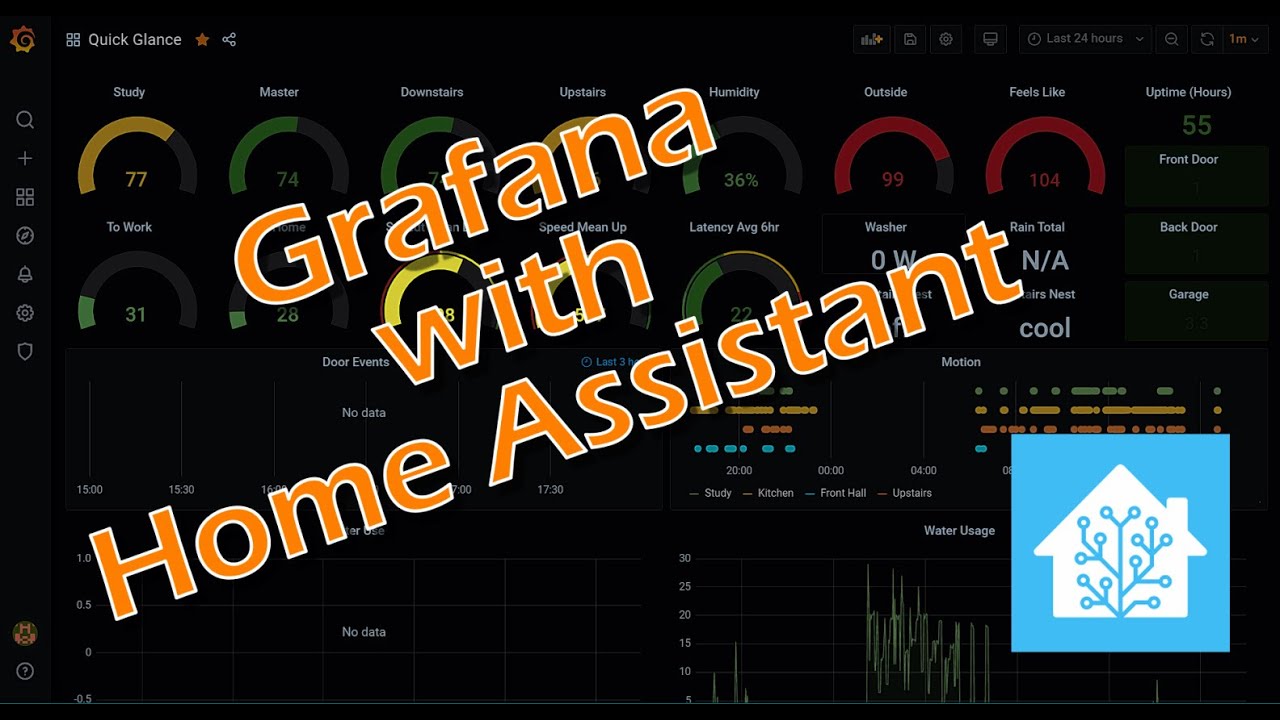
Using InfluxDB and Grafana to visualise Home Assistant Data
Home Assistant for iOS: https://apple.co/34JATce
Home Assistant for Android: https://bit.ly/30VUsNh
*** Timestamps ***
00:00 - Intro
01:01 - Installing the InfluxDB Add-On
01:55 - Creating Influx Database and Users
02:33 - Configuring Home Assistant to send data to InfluxDB
04:15 - Installing Grafana
04:49 - Configuring Grafana Data Sources
06:02 - Creating your first Grafana Dashboard
09:42 - formatting graphs
12:07 - Left/Right Axes
14:48 - Re-sizing Panels
16:49 - Bonus! - Your Dashboard in Google Chrome Kiosk Mode
18:22 - Outtro
*** Other Videos in this series ***
Video 1 - Installation: • Home Automation - Getting Started - Part 1
Video 2- Exploring the User Interface: • Getting Started - Part 2 - Home Assistant UI
Video 3 - Choosing Smart Home Accessories: • Getting Started Part 3 Choosing Access...
Video 4 - Getting Started with Automations: • Getting Started with Home Automation - Par...
Video 5 - Updating & Customising Home Assistant: • Getting Started with Home Assistant Part...
Video 6 - YAML Deep Dive: • Getting Started with Home Assistant - Part...
Video 7 - Customising the UI: • Getting Started with Home Assistant Part...
Video 8 - Mobile Apps: • Getting Started With Home Assistant - Par...
Video 9 - Homekit: • Getting Started with Home Assistant - Par...
Helpful Links:
Home Assistant: https://www.home-assistant.io/
Raspberry Pi: https://www.raspberrypi.org/
Balena Etcher: https://www.balena.io/etcher/
Music: https://www.purple-planet.com

Доступные форматы для скачивания:
Скачать видео mp4
-
Информация по загрузке: