Скачать
#boxplot
Автор: SomeSums
Загружено: 2025-12-26
Просмотров: 380
Описание:
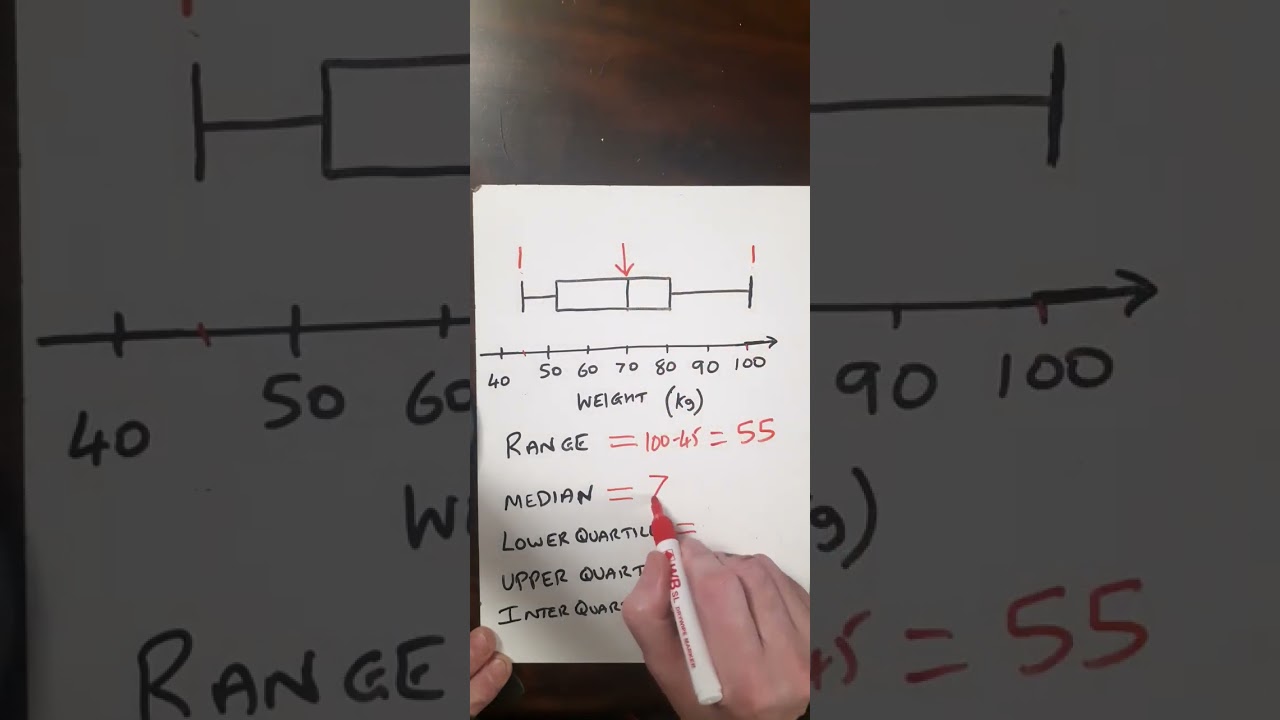
How to Calculate the Range , Median , Upper Quartile , Lower Quartile and Interquartile Range from a Stem and Whiskers Graph
In descriptive statistics, a box plot or boxplot is a method for demonstrating graphically the locality, spread and skewness groups of numerical data through their quartiles
• Difference between #simpleinterest and #co...
• #indices #fractional #negative #powersofx ...
• #simplifyingexpressions #mathematicseducat...
#alevelmath
#gcsemaths
#gcsemath
#gcsemathsrevision
#gcsemathematics
#statisticsclass11
#statisticshelp
#statisticstutorials #sumchief #somesums
Доступные форматы для скачивания:
Скачать видео mp4
-
Информация по загрузке:


