Consolidated Financial Reporting Made Easy — Even with Different Chart of Accounts
Автор: BI4Dynamics Asia Pacific
Загружено: 2026-01-14
Просмотров: 24
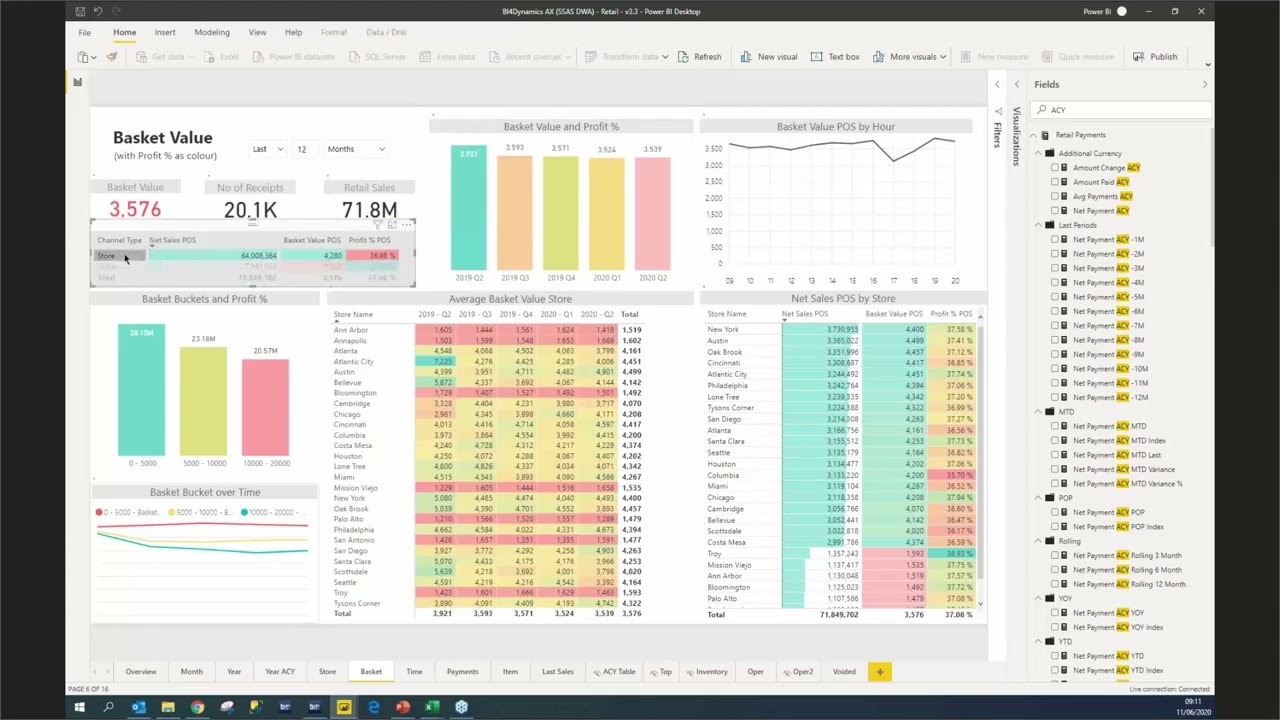
Creating consolidated financial analysis across group companies is challenging — especially when each company uses a different chart of accounts.
In this video, we show how to build a unified financial view for a company group, even when account structures are not the same.
You will learn:
• How to standardize financial data across multiple entities
• How to handle different chart of accounts in group reporting
• How consolidated financial analysis improves decision-making
• A practical approach using Power BI and Microsoft Dynamics data
This approach is commonly used by regional and global organizations
that require accurate, consistent group-level financial insights.
Ideal for:
• CFOs and Finance Managers
• Group Finance & Controlling teams
• Microsoft Dynamics 365 users
• Organizations with multiple legal entities
Learn how to turn complex financial structures into clear, actionable insights.
👉 Follow BI4Dynamics APAC for more Dynamics-focused BI content
👉 Learn more: https://www.bi4dynamics-apac.com
#FinancialConsolidation
#GroupReporting
#ChartOfAccounts
#PowerBI
#Dynamics365
#EnterpriseFinance
#BI4Dynamics

Доступные форматы для скачивания:
Скачать видео mp4
-
Информация по загрузке: