How To Create a Dual Axis Chart in Tableau
Автор: Sport Horizon
Загружено: 2025-02-13
Просмотров: 2419
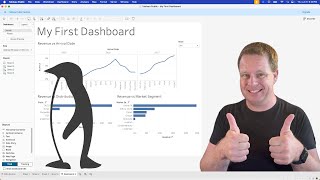
In this video, our new Sport Horizon Tutor - Jay Binning - takes you through how to create a beautiful dual axis chart in just a few steps on Tableau.
For what looks like a complicated chart, is in fact a really simple process. And in just 3 minutes, Jay takes you from a blank canvas in Tableau, to this really engaging and insightful chart. Take a look!
🚀 Welcome to the Sport Horizon YouTube Channel! 🚀
At Sport Horizon, we're dedicated to helping you excel in the world of sports data. Our videos offer tips, tutorials, and insights on Power BI, Tableau, Chat GPT, and more- tailored specifically for those working in sports performance and analytics.
🔔 Don't forget to subscribe and hit the bell icon to stay updated on our latest videos!
🔗 Connect with us:
Website: sporthorizon.co.uk
LinkedIn: / sport-horizon-uk
Twitter: / sporthorizonuk
📧 For business inquiries, contact us at [email protected]

Доступные форматы для скачивания:
Скачать видео mp4
-
Информация по загрузке:


![Excel и DeepSeek решат ВСЕ твои задачи за секунды! [Полный гайд]](https://ricktube.ru/thumbnail/1wuQdQ5QADw/mqdefault.jpg)