Скачать
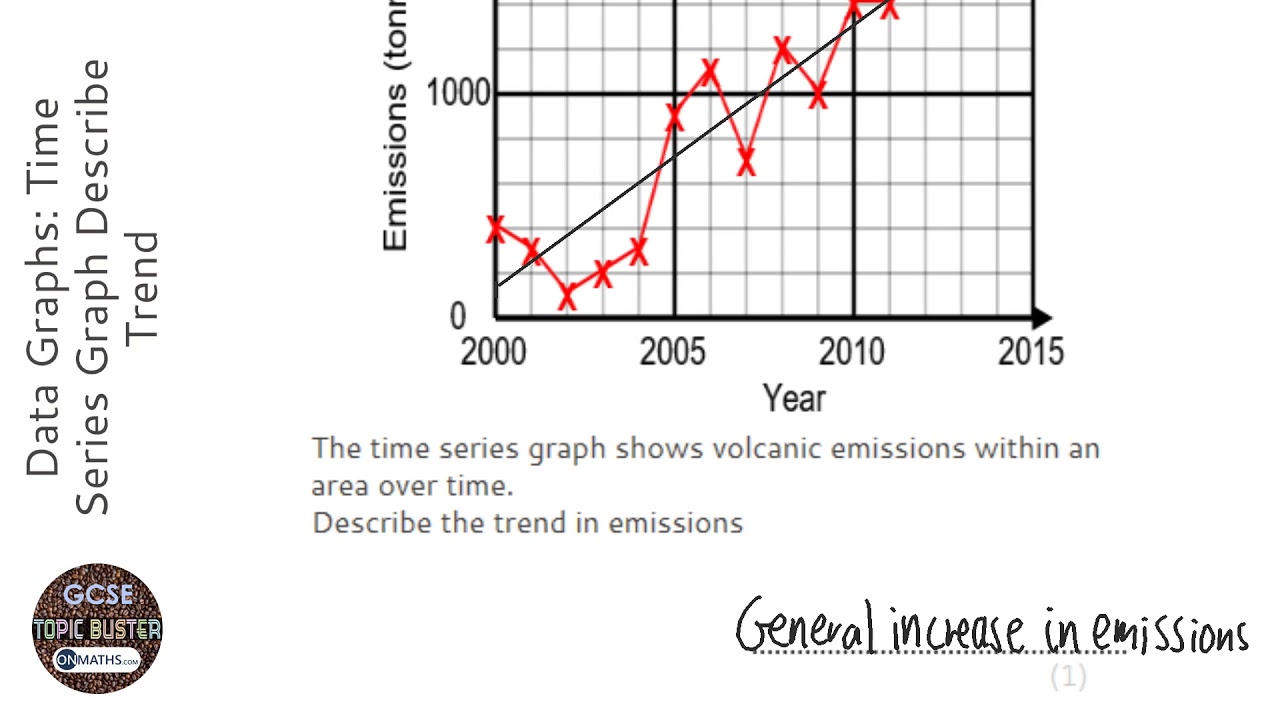
Data Graphs: Time Series Graph Describe Trend (Grade 3) - OnMaths GCSE Maths Revision
Автор: onmaths
Загружено: 2018-01-22
Просмотров: 9090
Описание:
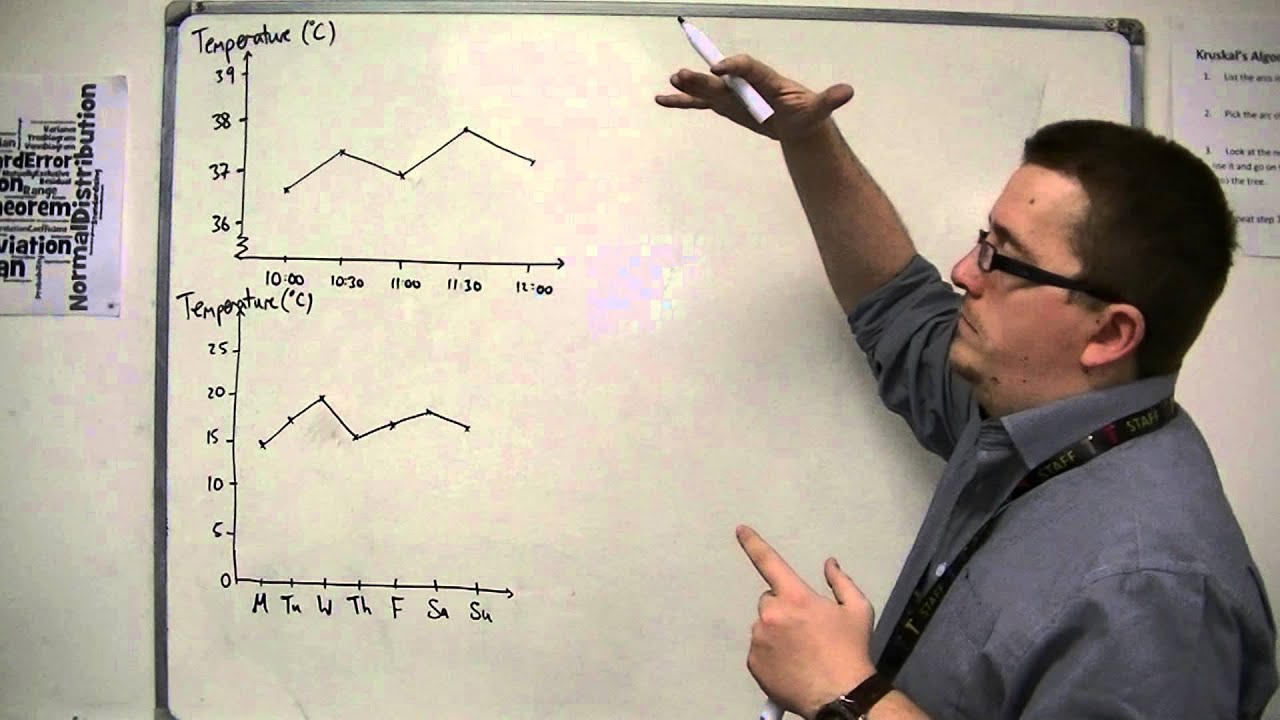
Topic: Data Graphs: Time Series Graph Describe Trend
Do this paper online for free: https://www.onmaths.com/data-graphs/
Grade: 3
This question appears on calculator and non-calculator higher and foundation GCSE papers.
Practise and revise with OnMaths.
Go to onmaths.com for more resources, like predicted GCSE Maths Papers, Topic Buster and challenge yourself against our Demon questions.
If you like this video, please click like and subscribe!
Доступные форматы для скачивания:
Скачать видео mp4
-
Информация по загрузке:


![Understand Box Plots in Statistics (Box-and-Whisker Plots) - [6-8-23]](https://imager.clipsaver.ru/cklvFT8dR64/max.jpg)


