What I Learned from Creating the PERFECT Excel Dashboard
Автор: Other Level’s
Загружено: Дата премьеры: 6 мар. 2024 г.
Просмотров: 34 079 просмотров
https://www.other-levels.com To Download our Templates & Get Free Datasets
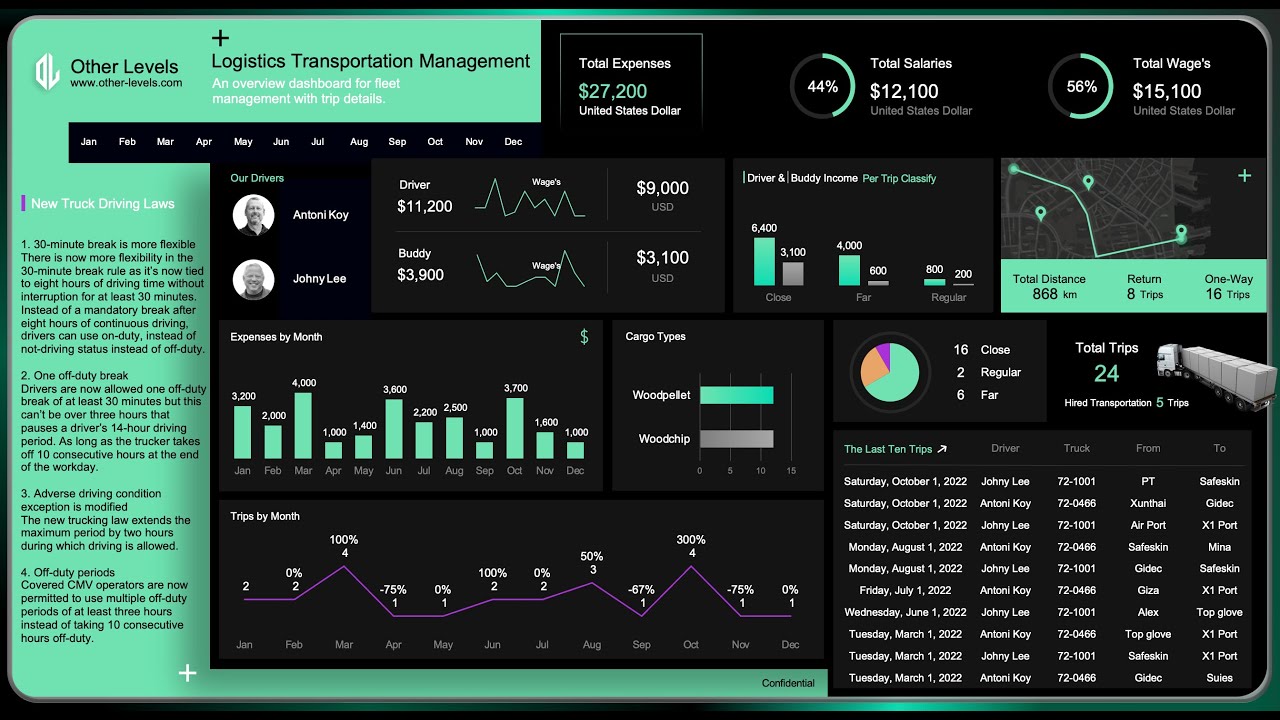
Advanced Logistics Transportation Management Excel Dashboard
To watch the full Tutorials? Join our channel Membership / @otherlevels
All our video / otherlevel’s
Request a Custom Dashboard https://other-levels.com/pages/custom...
Enhance Your Templates https://other-levels.com/pages/enhanc...
Courses & Playlists:
• Multiple Dynamic Excel Dashboards
• Single Dynamic Excel Dashboard
• Modern Excel Reports
• PowerPoint Slide's
All our video / otherlevel’s
Chapters:
0:00, Dashboard overview
0:38, Total trips & Hired Transportation
1:25, Trip's classification
2:13,Driver & Buddy wages Per Trip Classify
2:33,Cargo types
2:53,Total Expenses, Salaries, and Wages
3:48, Expenses by Month column chart
4:08, Total Distance
4:22, Total trips by month
4:54, Total drivers Salary & Wages
5:10, Total buddies Salary & Wages
5:26, wages by year
5:55, latest 10 trips details
Streamline your logistics operations with the Advanced Logistics Transportation Management Dashboard, a powerful Excel-based solution designed to provide complete control and insights into transportation expenses and trip performance. Perfect for businesses seeking efficiency, this dashboard simplifies data tracking and enhances decision-making through detailed analysis.
With this Management Dashboard, you can monitor expenses, trips, and shipments with ease. It offers an intuitive platform to analyze key metrics such as transportation costs, trip classifications, and shipment types. By identifying trends and performance across various metrics, businesses can optimize operations, reduce costs, and improve resource allocation.
Interactive charts and tables provide a clear overview of monthly expenses, total trips, and shipments by cargo type. This Excel Dashboard also empowers businesses to manage driver and crew performance by analyzing income and trip classifications. The dashboard fosters transparency and accountability, ensuring every trip and transaction is efficiently tracked.
Designed with simplicity in mind, the tool includes features for monitoring schedules and reviewing recent trip data, enabling managers to stay updated in real time. The dashboard also includes space for general notes, allowing users to document strategies, observations, or action plans directly within the file.
Whether you're managing a small fleet or a large transportation network, the Advanced Logistics Transportation Management Dashboard by Other Levels is your go-to solution for transforming raw data into actionable insights. Optimize your logistics workflow and make smarter decisions with this essential tool.
Key Features
Total expenses and its breakdowns salaries and wages
Total expenses by month
Expenses for the Drivers and buddies
The total distance for the trips
Total of the round-trip and the one-way trip
The total monthly trips
Total trips by month
Shipments by Cargo types
Analysis for each Trips Classify
Driver & Buddy Income per Trip Classify
Total Trips and the Hired transportation
Showing the latest ten trips schedule in details
General notes (Not Linked with the Slicers)
---------------------------------------------------------------------------------
Welcome to Other Level’s,
Your go to resource for unlocking the full potential of Microsoft Office.
Whether you're looking to enhance your skills in Excel, Word, PowerPoint, or data analysis, we simplify complex tools with clear, easy to follow tutorials.
Master Microsoft Office with Step by Step Tutorials and Expert Tips!
What sets us apart:
Comprehensive breakdown of essential formulas, digital designs, and data visualization techniques.
Straightforward, impactful videos focused on real world business applications.
We create professional dashboards that help you elevate your productivity and projects.
No unnecessary jargon just relevant content that helps you master Microsoft tools efficiently.
Honest, relevant titles and thumbnails that reflect the value we deliver in every video.
Join us and transform the way you work with Microsoft Office.
Every second of our content is designed to help you succeed!
Copyright © 2025 Other Level's. All rights reserved.
"Any illegal reproduction of this content in any form will result in immediate action against the person concerned."
#Excel #Dashboard #transportation
Доступные форматы для скачивания:
Скачать видео mp4
-
Информация по загрузке:


![Excel Tutorial for Beginners [Made Easy]](https://ricktube.ru/thumbnail/fzdn1vcHPsA/mqdefault.jpg)