Популярное

Музыка Кино и Анимация Автомобили Животные Спорт Путешествия Игры Юмор

Интересные видео

2025 Сериалы Трейлеры Новости Как сделать Видеоуроки Diy своими руками

Топ запросов

смотреть а4 schoolboy runaway турецкий сериал смотреть мультфильмы эдисон
dTub
Скачать

Basketball Analytics Tutorial Video: Using RStudio to retrieve and visualize player stats

Автор: Sweep Sports Analytics

Загружено: 2021-12-19

Просмотров: 1796

Описание:

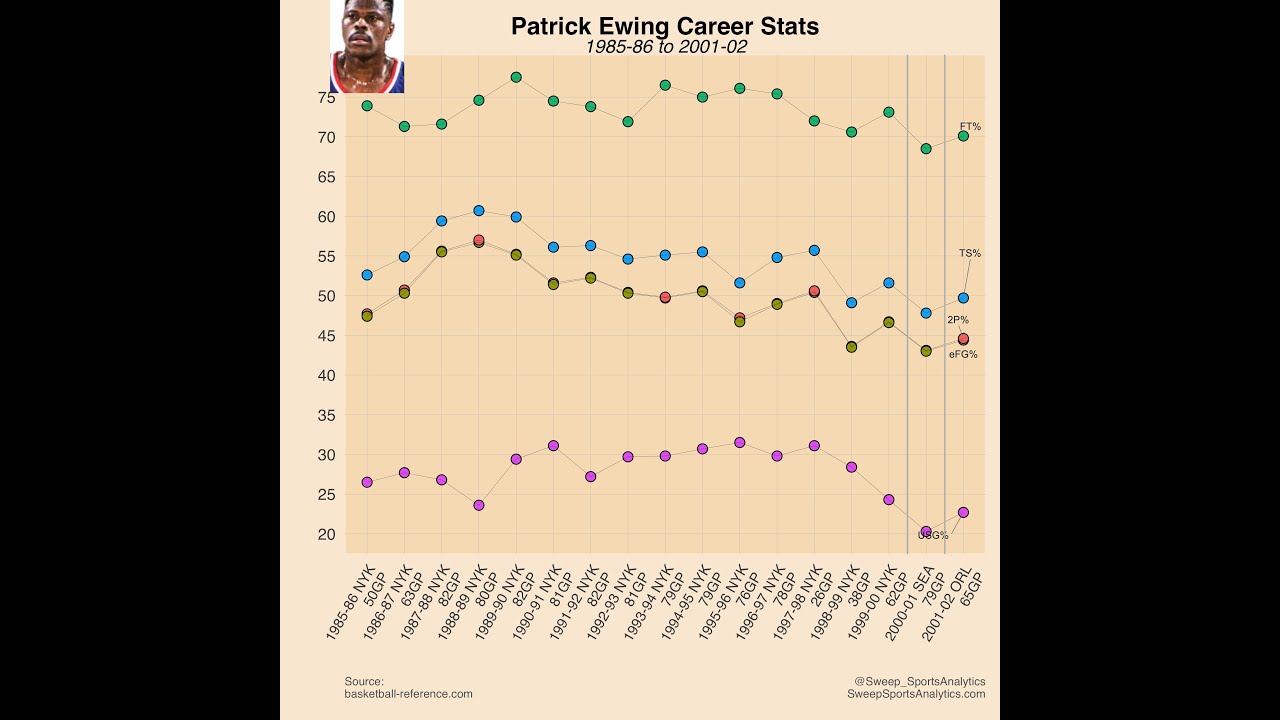
In this tutorial, I show you how to use RStudio to create graphs for player stats. First, we retrieve data from basketball-reference.com. Then, we retrieve some additional stats from the github repo of fivethirtyeight.com. Last, we use ggplot to create a graph.

You can find the written tutorial, including the code, at the link here: https://sweepsportsanalytics.com/2021...

Feel free to reach out for any questions and suggestions!

Follow for additional content on:
Instagram:   / sweep_sportsanalytics  
Facebook:   / sweepsportsanalytics  

Basketball Analytics Tutorial Video: Using RStudio to retrieve and visualize player stats

Поделиться в:

Доступные форматы для скачивания:

Скачать видео mp4

  • Информация по загрузке:

Скачать аудио mp3

Похожие видео

Soccer Analytics Tutorial: Scraping English Premier League Data using R

Soccer Analytics Tutorial: Scraping English Premier League Data using R

Episode 1: Beyond Basketball x Wizards Analytics Team

Episode 1: Beyond Basketball x Wizards Analytics Team

Tidy Tuesday R Screencasts

Tidy Tuesday R Screencasts

Spreadsheets #4 - NBA Stats - Big Data

Spreadsheets #4 - NBA Stats - Big Data

Crunching NBA Data with Python: Revealing the Home Court Advantage

Crunching NBA Data with Python: Revealing the Home Court Advantage

How to build a UFC sports betting model in R

How to build a UFC sports betting model in R

The NBA Data Scientist

The NBA Data Scientist

NBA Team & Player Performance Analysis with R | Sports Analytics

NBA Team & Player Performance Analysis with R | Sports Analytics

Introduction to Using R for Sport Science Data Analysis: Part 1

Introduction to Using R for Sport Science Data Analysis: Part 1

Хотели УНИЗИТЬ Уборщика, НО... | ANATOLY Gym Prank

Хотели УНИЗИТЬ Уборщика, НО... | ANATOLY Gym Prank

Conversation with Elon Musk | World Economic Forum Annual Meeting 2026

Conversation with Elon Musk | World Economic Forum Annual Meeting 2026

Find the Standard Deviation of NBA Team Game Scores in Excel Spreadsheet

Find the Standard Deviation of NBA Team Game Scores in Excel Spreadsheet

The Math Behind Basketball's Wildest Moves | Rajiv Maheswaran | TED Talks

The Math Behind Basketball's Wildest Moves | Rajiv Maheswaran | TED Talks

Getting Started with Tableau for Sports

Getting Started with Tableau for Sports

Typst: Современная замена Word и LaTeX, которую ждали 40 лет

Typst: Современная замена Word и LaTeX, которую ждали 40 лет

Basketball team uses data analytics designed by student

Basketball team uses data analytics designed by student

The Victorian Toy You Can't Buy

The Victorian Toy You Can't Buy

NBA Team Performance Statistical Analysis in R Part 5

NBA Team Performance Statistical Analysis in R Part 5

Зеленский разгромил союзников / Путин резко меняет тактику

Зеленский разгромил союзников / Путин резко меняет тактику

NBA Advanced Stats for DUMMIES

NBA Advanced Stats for DUMMIES

© 2025 dtub. Все права защищены.


  • Контакты
  • О нас
  • Политика конфиденциальности


Контакты для правообладателей: infodtube@gmail.com