BAR CHARTS in Excel Workbooks 🐍 Python & OpenPyXL | Data Automation
Автор: Data Automation
Загружено: 2023-12-19
Просмотров: 2007
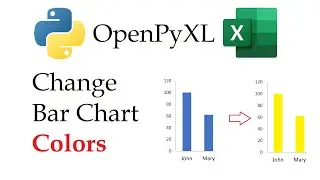
This video demonstrates how to add a simple `excel chart`, specifically a `bar graph in excel`, to an Excel workbook using the `openpyxl` Python library. You'll learn the steps for `python excel` integration to achieve `excel automation` by loading data, selecting a worksheet, and saving the file. I use Anaconda's Jupyter Lab interface in this tutorial.
😄 Please consider supporting this channel and making this content possible:
☕ https://www.buymeacoffee.com/DataAuto...
🅿 / dataautomation
00:00 :: Intro and Workbook Review
00:31 :: BarChart and Reference Imports & Creation
02:44 :: Adding Titles
03:05 :: Adding data with "add_data()"
04:05 :: Adding the Chart to the Workbook
04:55 :: Overview
#PythonExcelTutorial #openpyxl #data #DataAutomation #python #pythontutorial #excel #pythonautomation #pythonprogramming #jupyterlab #barcharts #barchart #columnchart

Доступные форматы для скачивания:
Скачать видео mp4
-
Информация по загрузке: